
With 74% ownership of the shares, Cisco Systems, Inc. (NASDAQ:CSCO) is heavily dominated by institutional owners
To get a sense of who is truly in control of Cisco Systems, Inc. (NASDAQ:CSCO), it is important to understand the ownership structure of the business. We can see that institutions own the lion's share in the company with 74% ownership. Put another way, the group faces the maximum upside potential (or downside risk).
Because institutional owners have a huge pool of resources and liquidity, their investing decisions tend to carry a great deal of weight, especially with individual investors. Hence, having a considerable amount of institutional money invested in a company is often regarded as a desirable trait.
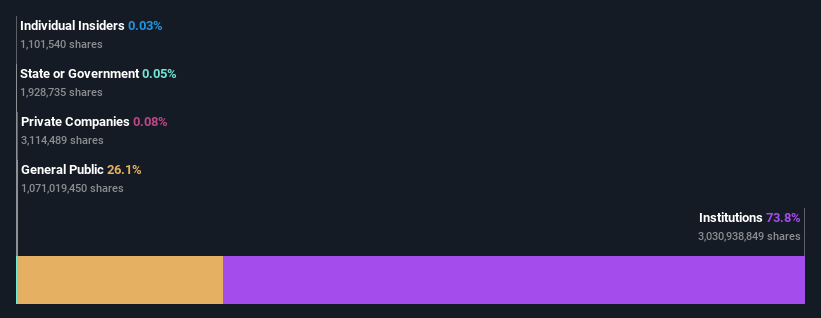
In the chart below, we zoom in on the different ownership groups of Cisco Systems.
Check out our latest analysis for Cisco Systems
What Does The Institutional Ownership Tell Us About Cisco Systems?
Institutional investors commonly compare their own returns to the returns of a commonly followed index. So they generally do consider buying larger companies that are included in the relevant benchmark index.
Cisco Systems already has institutions on the share registry. Indeed, they own a respectable stake in the company. This implies the analysts working for those institutions have looked at the stock and they like it. But just like anyone else, they could be wrong. When multiple institutions own a stock, there's always a risk that they are in a 'crowded trade'. When such a trade goes wrong, multiple parties may compete to sell stock fast. This risk is higher in a company without a history of growth. You can see Cisco Systems' historic earnings and revenue below, but keep in mind there's always more to the story.

Since institutional investors own more than half the issued stock, the board will likely have to pay attention to their preferences. We note that hedge funds don't have a meaningful investment in Cisco Systems. Looking at our data, we can see that the largest shareholder is The Vanguard Group, Inc. with 9.2% of shares outstanding. BlackRock, Inc. is the second largest shareholder owning 8.4% of common stock, and State Street Global Advisors, Inc. holds about 4.4% of the company stock.
On studying our ownership data, we found that 25 of the top shareholders collectively own less than 50% of the share register, implying that no single individual has a majority interest.
While studying institutional ownership for a company can add value to your research, it is also a good practice to research analyst recommendations to get a deeper understand of a stock's expected performance. There are plenty of analysts covering the stock, so it might be worth seeing what they are forecasting, too.
Insider Ownership Of Cisco Systems
The definition of an insider can differ slightly between different countries, but members of the board of directors always count. The company management answer to the board and the latter should represent the interests of shareholders. Notably, sometimes top-level managers are on the board themselves.
Most consider insider ownership a positive because it can indicate the board is well aligned with other shareholders. However, on some occasions too much power is concentrated within this group.
Our most recent data indicates that insiders own less than 1% of Cisco Systems, Inc.. As it is a large company, we'd only expect insiders to own a small percentage of it. But it's worth noting that they own US$54m worth of shares. Arguably recent buying and selling is just as important to consider. You can click here to see if insiders have been buying or selling.
General Public Ownership
The general public, who are usually individual investors, hold a 26% stake in Cisco Systems. This size of ownership, while considerable, may not be enough to change company policy if the decision is not in sync with other large shareholders.
Next Steps:
I find it very interesting to look at who exactly owns a company. But to truly gain insight, we need to consider other information, too.
I like to dive deeper into how a company has performed in the past. You can access this interactive graph of past earnings, revenue and cash flow, for free.
If you would prefer discover what analysts are predicting in terms of future growth, do not miss this free report on analyst forecasts.
NB: Figures in this article are calculated using data from the last twelve months, which refer to the 12-month period ending on the last date of the month the financial statement is dated. This may not be consistent with full year annual report figures.
Have feedback on this article? Concerned about the content? Get in touch with us directly. Alternatively, email editorial-team (at) simplywallst.com.
This article by Simply Wall St is general in nature. We provide commentary based on historical data and analyst forecasts only using an unbiased methodology and our articles are not intended to be financial advice. It does not constitute a recommendation to buy or sell any stock, and does not take account of your objectives, or your financial situation. We aim to bring you long-term focused analysis driven by fundamental data. Note that our analysis may not factor in the latest price-sensitive company announcements or qualitative material. Simply Wall St has no position in any stocks mentioned.
Join A Paid User Research Session
You’ll receive a US$30 Amazon Gift card for 1 hour of your time while helping us build better investing tools for the individual investors like yourself. Sign up here
