
Are APG|SGA SA’s (VTX:APGN) High Returns Really That Great?

Today we'll look at APG|SGA SA (VTX:APGN) and reflect on its potential as an investment. Specifically, we'll consider its Return On Capital Employed (ROCE), since that will give us an insight into how efficiently the business can generate profits from the capital it requires.
Firstly, we'll go over how we calculate ROCE. Second, we'll look at its ROCE compared to similar companies. And finally, we'll look at how its current liabilities are impacting its ROCE.
Return On Capital Employed (ROCE): What is it?
ROCE measures the 'return' (pre-tax profit) a company generates from capital employed in its business. Generally speaking a higher ROCE is better. Ultimately, it is a useful but imperfect metric. Renowned investment researcher Michael Mauboussin has suggested that a high ROCE can indicate that 'one dollar invested in the company generates value of more than one dollar'.
How Do You Calculate Return On Capital Employed?
The formula for calculating the return on capital employed is:
Return on Capital Employed = Earnings Before Interest and Tax (EBIT) ÷ (Total Assets - Current Liabilities)
Or for APG|SGA:
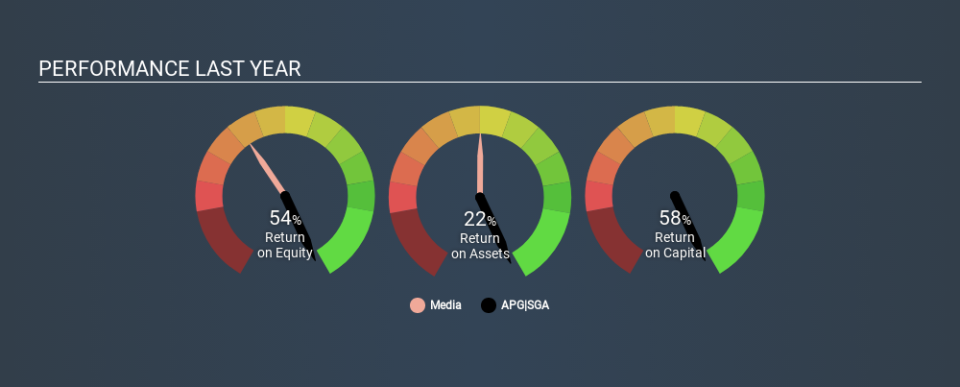
0.58 = CHF51m ÷ (CHF193m - CHF104m) (Based on the trailing twelve months to December 2019.)
So, APG|SGA has an ROCE of 58%.
Check out our latest analysis for APG|SGA
Is APG|SGA's ROCE Good?
ROCE can be useful when making comparisons, such as between similar companies. APG|SGA's ROCE appears to be substantially greater than the 10.0% average in the Media industry. I think that's good to see, since it implies the company is better than other companies at making the most of its capital. Putting aside its position relative to its industry for now, in absolute terms, APG|SGA's ROCE is currently very good.
In our analysis, APG|SGA's ROCE appears to be 58%, compared to 3 years ago, when its ROCE was 42%. This makes us wonder if the company is improving. The image below shows how APG|SGA's ROCE compares to its industry, and you can click it to see more detail on its past growth.
Remember that this metric is backwards looking - it shows what has happened in the past, and does not accurately predict the future. Companies in cyclical industries can be difficult to understand using ROCE, as returns typically look high during boom times, and low during busts. ROCE is, after all, simply a snap shot of a single year. What happens in the future is pretty important for investors, so we have prepared a free report on analyst forecasts for APG|SGA.
How APG|SGA's Current Liabilities Impact Its ROCE
Liabilities, such as supplier bills and bank overdrafts, are referred to as current liabilities if they need to be paid within 12 months. The ROCE equation subtracts current liabilities from capital employed, so a company with a lot of current liabilities appears to have less capital employed, and a higher ROCE than otherwise. To counter this, investors can check if a company has high current liabilities relative to total assets.
APG|SGA has total assets of CHF193m and current liabilities of CHF104m. As a result, its current liabilities are equal to approximately 54% of its total assets. APG|SGA's high level of current liabilities boost the ROCE - but its ROCE is still impressive.
The Bottom Line On APG|SGA's ROCE
In my book, this business could be worthy of further research. APG|SGA shapes up well under this analysis, but it is far from the only business delivering excellent numbers . You might also want to check this free collection of companies delivering excellent earnings growth.
For those who like to find winning investments this free list of growing companies with recent insider purchasing, could be just the ticket.
If you spot an error that warrants correction, please contact the editor at editorial-team@simplywallst.com. This article by Simply Wall St is general in nature. It does not constitute a recommendation to buy or sell any stock, and does not take account of your objectives, or your financial situation. Simply Wall St has no position in the stocks mentioned.
We aim to bring you long-term focused research analysis driven by fundamental data. Note that our analysis may not factor in the latest price-sensitive company announcements or qualitative material. Thank you for reading.

