
Should You Like Aurizon Holdings Limited’s (ASX:AZJ) High Return On Capital Employed?

Today we are going to look at Aurizon Holdings Limited (ASX:AZJ) to see whether it might be an attractive investment prospect. In particular, we'll consider its Return On Capital Employed (ROCE), as that can give us insight into how profitably the company is able to employ capital in its business.
First of all, we'll work out how to calculate ROCE. Next, we'll compare it to others in its industry. Finally, we'll look at how its current liabilities affect its ROCE.
What is Return On Capital Employed (ROCE)?
ROCE measures the 'return' (pre-tax profit) a company generates from capital employed in its business. Generally speaking a higher ROCE is better. In brief, it is a useful tool, but it is not without drawbacks. Author Edwin Whiting says to be careful when comparing the ROCE of different businesses, since 'No two businesses are exactly alike.
How Do You Calculate Return On Capital Employed?
The formula for calculating the return on capital employed is:
Return on Capital Employed = Earnings Before Interest and Tax (EBIT) ÷ (Total Assets - Current Liabilities)
Or for Aurizon Holdings:
0.11 = AU$923m ÷ (AU$9.6b - AU$1.4b) (Based on the trailing twelve months to December 2019.)
Therefore, Aurizon Holdings has an ROCE of 11%.
See our latest analysis for Aurizon Holdings
Is Aurizon Holdings's ROCE Good?
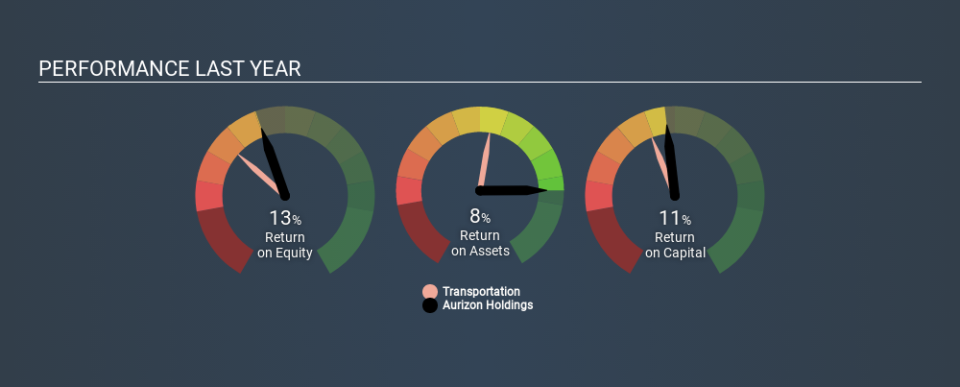
ROCE is commonly used for comparing the performance of similar businesses. Using our data, we find that Aurizon Holdings's ROCE is meaningfully better than the 7.0% average in the Transportation industry. We would consider this a positive, as it suggests it is using capital more effectively than other similar companies. Separate from Aurizon Holdings's performance relative to its industry, its ROCE in absolute terms looks satisfactory, and it may be worth researching in more depth.
You can click on the image below to see (in greater detail) how Aurizon Holdings's past growth compares to other companies.
When considering this metric, keep in mind that it is backwards looking, and not necessarily predictive. Companies in cyclical industries can be difficult to understand using ROCE, as returns typically look high during boom times, and low during busts. ROCE is only a point-in-time measure. Since the future is so important for investors, you should check out our free report on analyst forecasts for Aurizon Holdings.
What Are Current Liabilities, And How Do They Affect Aurizon Holdings's ROCE?
Current liabilities are short term bills and invoices that need to be paid in 12 months or less. The ROCE equation subtracts current liabilities from capital employed, so a company with a lot of current liabilities appears to have less capital employed, and a higher ROCE than otherwise. To counteract this, we check if a company has high current liabilities, relative to its total assets.
Aurizon Holdings has current liabilities of AU$1.4b and total assets of AU$9.6b. Therefore its current liabilities are equivalent to approximately 14% of its total assets. Current liabilities are minimal, limiting the impact on ROCE.
What We Can Learn From Aurizon Holdings's ROCE
This is good to see, and with a sound ROCE, Aurizon Holdings could be worth a closer look. Aurizon Holdings looks strong on this analysis, but there are plenty of other companies that could be a good opportunity . Here is a free list of companies growing earnings rapidly.
If you like to buy stocks alongside management, then you might just love this free list of companies. (Hint: insiders have been buying them).
Love or hate this article? Concerned about the content? Get in touch with us directly. Alternatively, email editorial-team@simplywallst.com.
This article by Simply Wall St is general in nature. It does not constitute a recommendation to buy or sell any stock, and does not take account of your objectives, or your financial situation. We aim to bring you long-term focused analysis driven by fundamental data. Note that our analysis may not factor in the latest price-sensitive company announcements or qualitative material. Simply Wall St has no position in any stocks mentioned. Thank you for reading.

