
A Close Look At Allied Farmers Limited’s (NZSE:ALF) 30% ROCE

Today we'll look at Allied Farmers Limited (NZSE:ALF) and reflect on its potential as an investment. Specifically, we'll consider its Return On Capital Employed (ROCE), since that will give us an insight into how efficiently the business can generate profits from the capital it requires.
First, we'll go over how we calculate ROCE. Second, we'll look at its ROCE compared to similar companies. Finally, we'll look at how its current liabilities affect its ROCE.
What is Return On Capital Employed (ROCE)?
ROCE measures the amount of pre-tax profits a company can generate from the capital employed in its business. In general, businesses with a higher ROCE are usually better quality. Ultimately, it is a useful but imperfect metric. Renowned investment researcher Michael Mauboussin has suggested that a high ROCE can indicate that 'one dollar invested in the company generates value of more than one dollar'.
How Do You Calculate Return On Capital Employed?
Analysts use this formula to calculate return on capital employed:
Return on Capital Employed = Earnings Before Interest and Tax (EBIT) ÷ (Total Assets - Current Liabilities)
Or for Allied Farmers:
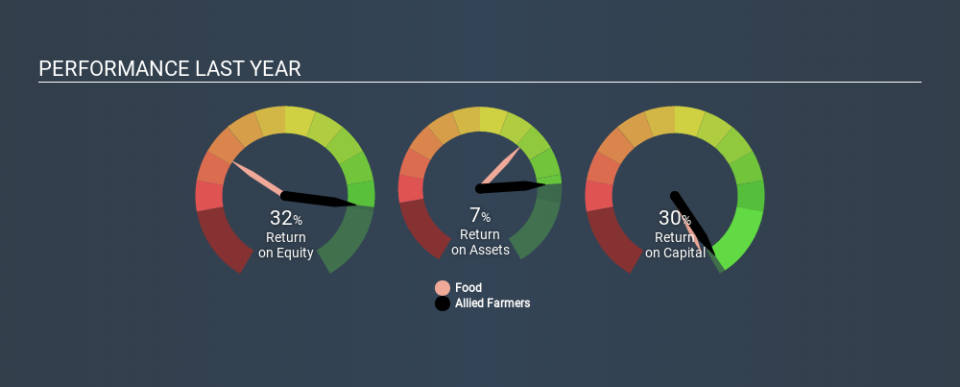
0.30 = NZ$2.8m ÷ (NZ$23m - NZ$14m) (Based on the trailing twelve months to December 2019.)
So, Allied Farmers has an ROCE of 30%.
View our latest analysis for Allied Farmers
Is Allied Farmers's ROCE Good?
ROCE can be useful when making comparisons, such as between similar companies. In our analysis, Allied Farmers's ROCE is meaningfully higher than the 7.9% average in the Food industry. We would consider this a positive, as it suggests it is using capital more effectively than other similar companies. Setting aside the comparison to its industry for a moment, Allied Farmers's ROCE in absolute terms currently looks quite high.
We can see that, Allied Farmers currently has an ROCE of 30%, less than the 53% it reported 3 years ago. So investors might consider if it has had issues recently. You can click on the image below to see (in greater detail) how Allied Farmers's past growth compares to other companies.
When considering this metric, keep in mind that it is backwards looking, and not necessarily predictive. Companies in cyclical industries can be difficult to understand using ROCE, as returns typically look high during boom times, and low during busts. ROCE is, after all, simply a snap shot of a single year. If Allied Farmers is cyclical, it could make sense to check out this free graph of past earnings, revenue and cash flow.
What Are Current Liabilities, And How Do They Affect Allied Farmers's ROCE?
Liabilities, such as supplier bills and bank overdrafts, are referred to as current liabilities if they need to be paid within 12 months. Due to the way the ROCE equation works, having large bills due in the near term can make it look as though a company has less capital employed, and thus a higher ROCE than usual. To counteract this, we check if a company has high current liabilities, relative to its total assets.
Allied Farmers has total assets of NZ$23m and current liabilities of NZ$14m. Therefore its current liabilities are equivalent to approximately 59% of its total assets. While a high level of current liabilities boosts its ROCE, Allied Farmers's returns are still very good.
Our Take On Allied Farmers's ROCE
So to us, the company is potentially worth investigating further. Allied Farmers shapes up well under this analysis, but it is far from the only business delivering excellent numbers . You might also want to check this free collection of companies delivering excellent earnings growth.
I will like Allied Farmers better if I see some big insider buys. While we wait, check out this free list of growing companies with considerable, recent, insider buying.
If you spot an error that warrants correction, please contact the editor at editorial-team@simplywallst.com. This article by Simply Wall St is general in nature. It does not constitute a recommendation to buy or sell any stock, and does not take account of your objectives, or your financial situation. Simply Wall St has no position in the stocks mentioned.
We aim to bring you long-term focused research analysis driven by fundamental data. Note that our analysis may not factor in the latest price-sensitive company announcements or qualitative material. Thank you for reading.

