
Is Delfi Limited's (SGX:P34) High P/E Ratio A Problem For Investors?

The goal of this article is to teach you how to use price to earnings ratios (P/E ratios). We'll apply a basic P/E ratio analysis to Delfi Limited's (SGX:P34), to help you decide if the stock is worth further research. Looking at earnings over the last twelve months, Delfi has a P/E ratio of 16.28. That corresponds to an earnings yield of approximately 6.1%.
View our latest analysis for Delfi
How Do I Calculate A Price To Earnings Ratio?
The formula for P/E is:
Price to Earnings Ratio = Price per Share (in the reporting currency) ÷ Earnings per Share (EPS)
Or for Delfi:
P/E of 16.28 = USD0.68 (Note: this is the share price in the reporting currency, namely, USD ) ÷ USD0.04 (Based on the trailing twelve months to September 2019.)
Is A High Price-to-Earnings Ratio Good?
A higher P/E ratio means that investors are paying a higher price for each USD1 of company earnings. That isn't necessarily good or bad, but a high P/E implies relatively high expectations of what a company can achieve in the future.
Does Delfi Have A Relatively High Or Low P/E For Its Industry?
The P/E ratio essentially measures market expectations of a company. You can see in the image below that the average P/E (14.7) for companies in the food industry is lower than Delfi's P/E.
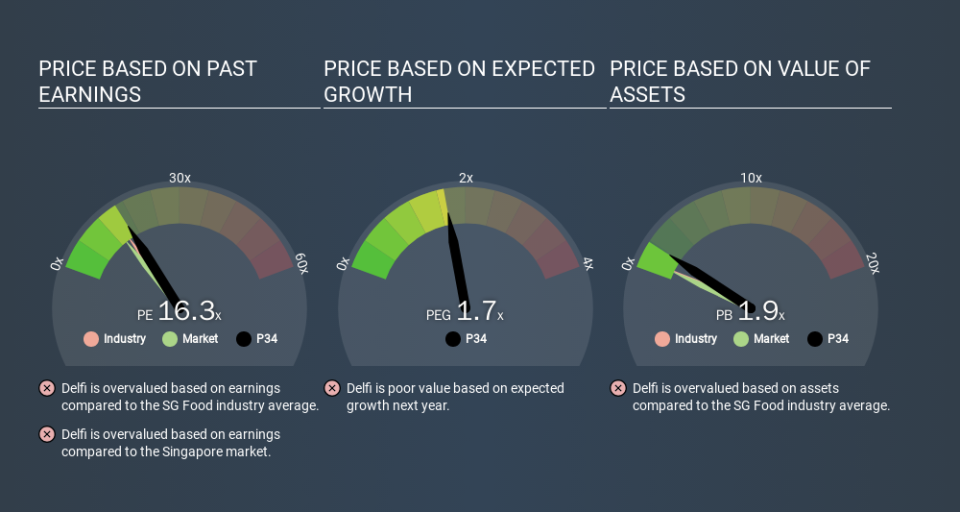
Its relatively high P/E ratio indicates that Delfi shareholders think it will perform better than other companies in its industry classification. Clearly the market expects growth, but it isn't guaranteed. So investors should delve deeper. I like to check if company insiders have been buying or selling.
How Growth Rates Impact P/E Ratios
Generally speaking the rate of earnings growth has a profound impact on a company's P/E multiple. That's because companies that grow earnings per share quickly will rapidly increase the 'E' in the equation. That means unless the share price increases, the P/E will reduce in a few years. Then, a lower P/E should attract more buyers, pushing the share price up.
It's nice to see that Delfi grew EPS by a stonking 33% in the last year. And earnings per share have improved by 2.9% annually, over the last three years. I'd therefore be a little surprised if its P/E ratio was not relatively high. Unfortunately, earnings per share are down 13% a year, over 5 years.
Don't Forget: The P/E Does Not Account For Debt or Bank Deposits
It's important to note that the P/E ratio considers the market capitalization, not the enterprise value. Thus, the metric does not reflect cash or debt held by the company. Theoretically, a business can improve its earnings (and produce a lower P/E in the future) by investing in growth. That means taking on debt (or spending its cash).
Such spending might be good or bad, overall, but the key point here is that you need to look at debt to understand the P/E ratio in context.
So What Does Delfi's Balance Sheet Tell Us?
Since Delfi holds net cash of US$4.2m, it can spend on growth, justifying a higher P/E ratio than otherwise.
The Verdict On Delfi's P/E Ratio
Delfi's P/E is 16.3 which is above average (13.5) in its market. The excess cash it carries is the gravy on top its fast EPS growth. So based on this analysis we'd expect Delfi to have a high P/E ratio.
When the market is wrong about a stock, it gives savvy investors an opportunity. As value investor Benjamin Graham famously said, 'In the short run, the market is a voting machine but in the long run, it is a weighing machine. So this free visualization of the analyst consensus on future earnings could help you make the right decision about whether to buy, sell, or hold.
Of course you might be able to find a better stock than Delfi. So you may wish to see this free collection of other companies that have grown earnings strongly.
If you spot an error that warrants correction, please contact the editor at editorial-team@simplywallst.com. This article by Simply Wall St is general in nature. It does not constitute a recommendation to buy or sell any stock, and does not take account of your objectives, or your financial situation. Simply Wall St has no position in the stocks mentioned.
We aim to bring you long-term focused research analysis driven by fundamental data. Note that our analysis may not factor in the latest price-sensitive company announcements or qualitative material. Thank you for reading.

