
How Does NorthWestern's (NYSE:NWE) P/E Compare To Its Industry, After The Share Price Drop?

To the annoyance of some shareholders, NorthWestern (NYSE:NWE) shares are down a considerable 32% in the last month. The recent drop has obliterated the annual return, with the share price now down 25% over that longer period.
Assuming nothing else has changed, a lower share price makes a stock more attractive to potential buyers. In the long term, share prices tend to follow earnings per share, but in the short term prices bounce around in response to short term factors (which are not always obvious). The implication here is that long term investors have an opportunity when expectations of a company are too low. Perhaps the simplest way to get a read on investors' expectations of a business is to look at its Price to Earnings Ratio (PE Ratio). Investors have optimistic expectations of companies with higher P/E ratios, compared to companies with lower P/E ratios.
See our latest analysis for NorthWestern
How Does NorthWestern's P/E Ratio Compare To Its Peers?
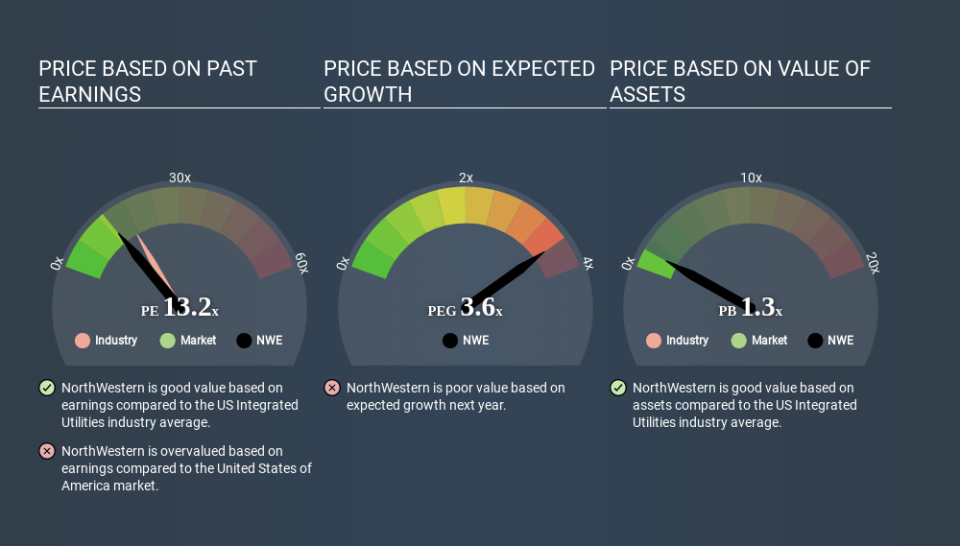
NorthWestern's P/E of 13.18 indicates relatively low sentiment towards the stock. The image below shows that NorthWestern has a lower P/E than the average (17.5) P/E for companies in the integrated utilities industry.
NorthWestern's P/E tells us that market participants think it will not fare as well as its peers in the same industry. Many investors like to buy stocks when the market is pessimistic about their prospects. It is arguably worth checking if insiders are buying shares, because that might imply they believe the stock is undervalued.
How Growth Rates Impact P/E Ratios
P/E ratios primarily reflect market expectations around earnings growth rates. When earnings grow, the 'E' increases, over time. And in that case, the P/E ratio itself will drop rather quickly. A lower P/E should indicate the stock is cheap relative to others -- and that may attract buyers.
NorthWestern's earnings per share were pretty steady over the last year. But EPS is up 5.9% over the last 5 years.
A Limitation: P/E Ratios Ignore Debt and Cash In The Bank
One drawback of using a P/E ratio is that it considers market capitalization, but not the balance sheet. Thus, the metric does not reflect cash or debt held by the company. Hypothetically, a company could reduce its future P/E ratio by spending its cash (or taking on debt) to achieve higher earnings.
Spending on growth might be good or bad a few years later, but the point is that the P/E ratio does not account for the option (or lack thereof).
So What Does NorthWestern's Balance Sheet Tell Us?
NorthWestern has net debt worth 84% of its market capitalization. If you want to compare its P/E ratio to other companies, you should absolutely keep in mind it has significant borrowings.
The Verdict On NorthWestern's P/E Ratio
NorthWestern has a P/E of 13.2. That's around the same as the average in the US market, which is 12.4. With meaningful debt and only modest earnings growth, the market seems to be expecting a steady performance going forward. What can be absolutely certain is that the market has become significantly less optimistic about NorthWestern over the last month, with the P/E ratio falling from 19.4 back then to 13.2 today. For those who don't like to trade against momentum, that could be a warning sign, but a contrarian investor might want to take a closer look.
Investors have an opportunity when market expectations about a stock are wrong. As value investor Benjamin Graham famously said, 'In the short run, the market is a voting machine but in the long run, it is a weighing machine. So this free visual report on analyst forecasts could hold the key to an excellent investment decision.
But note: NorthWestern may not be the best stock to buy. So take a peek at this free list of interesting companies with strong recent earnings growth (and a P/E ratio below 20).
If you spot an error that warrants correction, please contact the editor at editorial-team@simplywallst.com. This article by Simply Wall St is general in nature. It does not constitute a recommendation to buy or sell any stock, and does not take account of your objectives, or your financial situation. Simply Wall St has no position in the stocks mentioned.
We aim to bring you long-term focused research analysis driven by fundamental data. Note that our analysis may not factor in the latest price-sensitive company announcements or qualitative material. Thank you for reading.

