
Does This Valuation Of Paramount Resources Ltd. (TSE:POU) Imply Investors Are Overpaying?

Today we'll do a simple run through of a valuation method used to estimate the attractiveness of Paramount Resources Ltd. (TSE:POU) as an investment opportunity by taking the expected future cash flows and discounting them to their present value. I will be using the Discounted Cash Flow (DCF) model. It may sound complicated, but actually it is quite simple!
Companies can be valued in a lot of ways, so we would point out that a DCF is not perfect for every situation. If you want to learn more about discounted cash flow, the rationale behind this calculation can be read in detail in the Simply Wall St analysis model.
View our latest analysis for Paramount Resources
Is Paramount Resources fairly valued?
We are going to use a two-stage DCF model, which, as the name states, takes into account two stages of growth. The first stage is generally a higher growth period which levels off heading towards the terminal value, captured in the second 'steady growth' period. To begin with, we have to get estimates of the next ten years of cash flows. Where possible we use analyst estimates, but when these aren't available we extrapolate the previous free cash flow (FCF) from the last estimate or reported value. We assume companies with shrinking free cash flow will slow their rate of shrinkage, and that companies with growing free cash flow will see their growth rate slow, over this period. We do this to reflect that growth tends to slow more in the early years than it does in later years.
A DCF is all about the idea that a dollar in the future is less valuable than a dollar today, and so the sum of these future cash flows is then discounted to today's value:
10-year free cash flow (FCF) estimate
2020 | 2021 | 2022 | 2023 | 2024 | 2025 | 2026 | 2027 | 2028 | 2029 | |
Levered FCF (CA$, Millions) | -CA$126.4m | -CA$100.8m | -CA$107.0m | CA$28.0m | CA$38.0m | CA$47.7m | CA$56.4m | CA$63.9m | CA$70.1m | CA$75.1m |
Growth Rate Estimate Source | Analyst x8 | Analyst x9 | Analyst x1 | Analyst x1 | Est @ 35.78% | Est @ 25.48% | Est @ 18.27% | Est @ 13.22% | Est @ 9.69% | Est @ 7.21% |
Present Value (CA$, Millions) Discounted @ 12% | -CA$112.5 | -CA$79.9 | -CA$75.5 | CA$17.6 | CA$21.3 | CA$23.8 | CA$25.0 | CA$25.2 | CA$24.6 | CA$23.5 |
("Est" = FCF growth rate estimated by Simply Wall St)
Present Value of 10-year Cash Flow (PVCF) = -CA$106.0m
We now need to calculate the Terminal Value, which accounts for all the future cash flows after this ten year period. The Gordon Growth formula is used to calculate Terminal Value at a future annual growth rate equal to the 10-year government bond rate of 1.4%. We discount the terminal cash flows to today's value at a cost of equity of 12%.
Terminal Value (TV)= FCF2029 × (1 + g) ÷ (r – g) = CA$75m× (1 + 1.4%) ÷ 12%– 1.4%) = CA$700m
Present Value of Terminal Value (PVTV)= TV / (1 + r)10= CA$700m÷ ( 1 + 12%)10= CA$219m
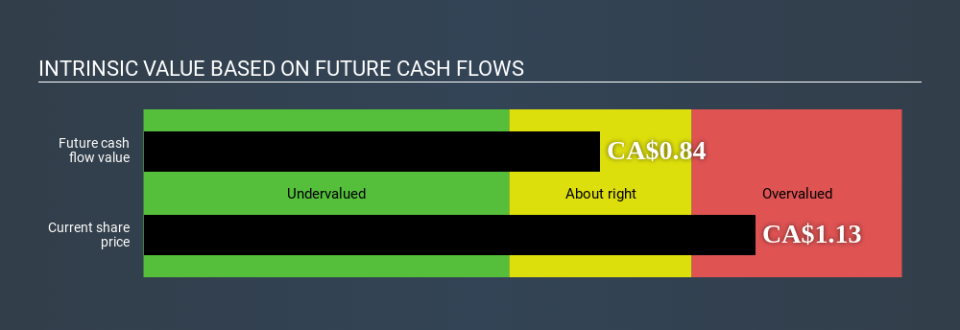
The total value is the sum of cash flows for the next ten years plus the discounted terminal value, which results in the Total Equity Value, which in this case is CA$113m. To get the intrinsic value per share, we divide this by the total number of shares outstanding. Compared to the current share price of CA$1.1, the company appears potentially overvalued at the time of writing. Valuations are imprecise instruments though, rather like a telescope - move a few degrees and end up in a different galaxy. Do keep this in mind.
The assumptions
Now the most important inputs to a discounted cash flow are the discount rate, and of course, the actual cash flows. Part of investing is coming up with your own evaluation of a company's future performance, so try the calculation yourself and check your own assumptions. The DCF also does not consider the possible cyclicality of an industry, or a company's future capital requirements, so it does not give a full picture of a company's potential performance. Given that we are looking at Paramount Resources as potential shareholders, the cost of equity is used as the discount rate, rather than the cost of capital (or weighted average cost of capital, WACC) which accounts for debt. In this calculation we've used 12%, which is based on a levered beta of 2.000. Beta is a measure of a stock's volatility, compared to the market as a whole. We get our beta from the industry average beta of globally comparable companies, with an imposed limit between 0.8 and 2.0, which is a reasonable range for a stable business.
Next Steps:
Whilst important, DCF calculation shouldn’t be the only metric you look at when researching a company. The DCF model is not a perfect stock valuation tool. Rather it should be seen as a guide to "what assumptions need to be true for this stock to be under/overvalued?" If a company grows at a different rate, or if its cost of equity or risk free rate changes sharply, the output can look very different. What is the reason for the share price to differ from the intrinsic value? For Paramount Resources, There are three pertinent factors you should further research:
Risks: Consider for instance, the ever-present spectre of investment risk. We've identified 5 warning signs with Paramount Resources (at least 2 which don't sit too well with us) , and understanding these should be part of your investment process.
Future Earnings: How does POU's growth rate compare to its peers and the wider market? Dig deeper into the analyst consensus number for the upcoming years by interacting with our free analyst growth expectation chart.
Other Solid Businesses: Low debt, high returns on equity and good past performance are fundamental to a strong business. Why not explore our interactive list of stocks with solid business fundamentals to see if there are other companies you may not have considered!
PS. Simply Wall St updates its DCF calculation for every CA stock every day, so if you want to find the intrinsic value of any other stock just search here.
If you spot an error that warrants correction, please contact the editor at editorial-team@simplywallst.com. This article by Simply Wall St is general in nature. It does not constitute a recommendation to buy or sell any stock, and does not take account of your objectives, or your financial situation. Simply Wall St has no position in the stocks mentioned.
We aim to bring you long-term focused research analysis driven by fundamental data. Note that our analysis may not factor in the latest price-sensitive company announcements or qualitative material. Thank you for reading.

