
These five graphics paint a picture of the latest COVID wave in Missouri
In the past few weeks, COVID-19 cases in Missouri have reached record highs. The latest surge in the pandemic is largely due to the highly contagious omicron variant which has become the more predominant strain across the U.S.
Although cases of omicron cause mild symptoms in some, it continues to break records in recent deaths, child hospitalizations and case numbers.
To better understand how this spike in cases is affecting Missouri, check out these five graphics below.
How many COVID-19 cases are in Missouri?
As of Jan. 14., there are over 15,000 cases of COVID-19 in Missouri. The rolling average of cases is climbing above 11,700 cases per week. Check out this graph to see how the number cases has evolved from the start of the pandemic until now.
What is the vaccination rate?
More than 3 million Missouri residents have been fully-vaccinated against the COVID-19 virus, giving the state a 53% vaccination rate.
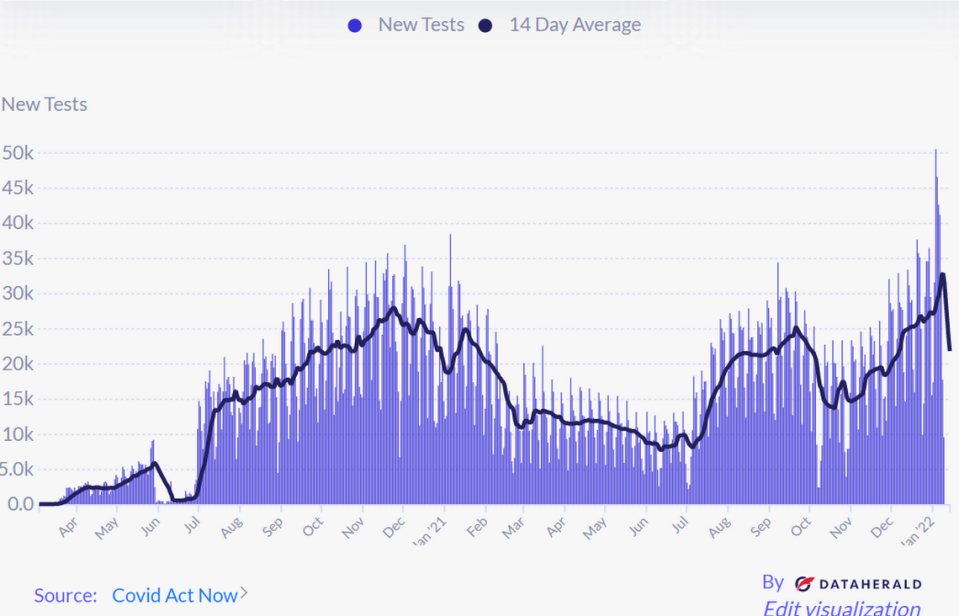
How many people are getting tested?
On the week of Jan. 9, there were more than 17,000 COVID-19 tests administered. The positivity rate is more than 11%.
How many people are being hospitalized?
Only 15% of Missouri hospital beds were available earlier this week, the Associated Press reported. Check this graph to see how many people are being hospitalized across the state and how many are in the ICU.
What is the current COVID-19 death rate?
There were 20 new deaths due to COVID-19 during the week of Jan. 14. See below to see how that number compares to past weeks.
