
Google charts how the pandemic has changed New Brunswickers' routines
Google released charts that appear to show how the routines of New Brunswickers have changed as a result of the pandemic.
The company published charts Friday comparing recent traffic at locations, such as grocery stores, to traffic during the month of January.
It shows growing traffic to grocery stores as the first cases were confirmed in the province and plunging use of transit stations in the weeks that followed.
Google states in a blog post that the information is meant to help governments gauge the effectiveness of measures to control the spread of the novel coronavirus, which has radically altered routines and what can stay open.
The information is collected from users of Google applications who have consented to the company collecting their data.

David Fraser, a Halifax-based privacy lawyer with McInnes Cooper, said it's not the sort of information he's concerned about.
Fraser, who has represented Google in the past, said from a privacy perspective he is comfortable with how the data has been collected and presented.
He said looking at the graphs for Nova Scotia, where he lives, you wouldn't be able to tell which "microscopic data point" is him.
"If this is information that's useful to public health authorities in order to determine whether or not people are following the guidance related to working from home and self-isolation and all those sorts of things we've been hearing so much about, then hopefully it's useful in that regard," Fraser said.
CBC News has asked the New Brunswick government if it is aware of the information and whether it is useful, but no one has responded yet.
How it works
The information released Friday outlines movement trends across 131 countries or regions, providing an overall percentage change for six broad categories of locations like retail and recreation.
The company states the aggregated, anonymized data was collected from people using Google products who turned on the location history setting, one that's off by default.
The data compares behaviour between Feb. 16 and March 29 to the same days of the week between Jan. 3 and Feb. 6.
The information collected is typically used by the company in Google Maps to show things like congested roadways or popular times at businesses.
Fraser said it's a setting he has turned on, which has proven to be useful for trying to remember details such as a restaurant he visited years ago.
He noted that if he were to become ill with the coronavirus, he could use the location history function to help public health officials track where he has been and who he may have been in contact with.
It's not clear how many users the New Brunswick trends are based on, but the company says it leaves out regions if it doesn't have "statistically significant levels of data."
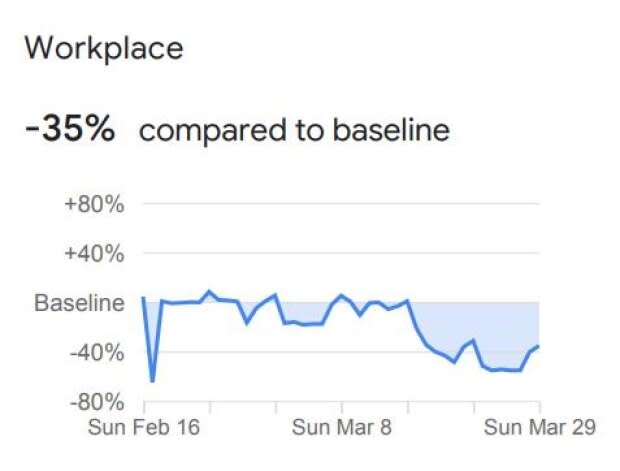
Movement in workplaces dropped 35 per cent compared to the baseline, with the biggest dip around Sunday, March 16. By that point, the province had approximately six confirmed or presumptive-positive cases of COVID-19.
Fraser noted the company doesn't differentiate between essential and non-essential workplaces.
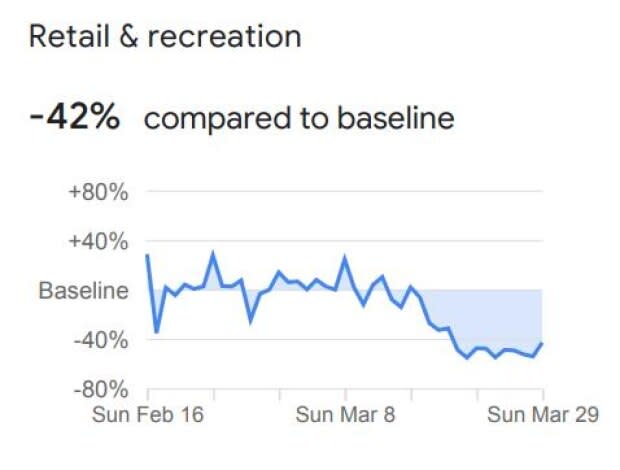
Retail and recreation plunged 42 per cent compared to the baseline time period. The category includes restaurants, cafes, shopping centres, theme parks, museums, libraries and movie theaters.
The chart shows peaks and troughs until the week of March 16, at which point the trend line plunges.
The province declared a state of emergency March 19, ordering many businesses in that category to close or change their operations to meet physical distancing requirements.

Grocery and pharmacy locations dropped 20 per cent overall. However, the chart does show a spike in activity at these locations in early March as the province's first cases were announced.
Photos of empty store shelves were common and government officials urged people not to panic-buy goods. The trend line dips around the week of March 18.
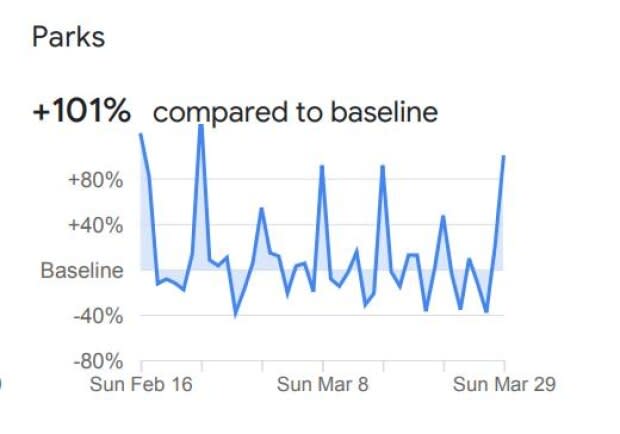
Large spikes are recorded in weekend use of parks, which is a category that includes national parks, public beaches, marinas, dog parks, plazas and public gardens. Overall, the use of parks was up 101 per cent compared to the baseline.
There have at times been conflicting messages about the use of parks. National and provincial parks have closed while some municipal facilities in the province are also closed.
A large spike was recorded the weekend of March 29.
Dr. Jennifer Russell, the province's chief medical officer of health, suggested in a Saturday, March 28 news release that with good weather "people enjoy the outdoors while practising physical distancing" that weekend.
Over the following days, Premier Blaine Higgs was asked multiple times by reporters about parks as photos of packed parking lots were shared online.
On Tuesday, he said he expected municipalities to follow the province's lead and close them. By Wednesday, his stance had shifted. Higgs said parks can remain open if physical distancing is enforced.
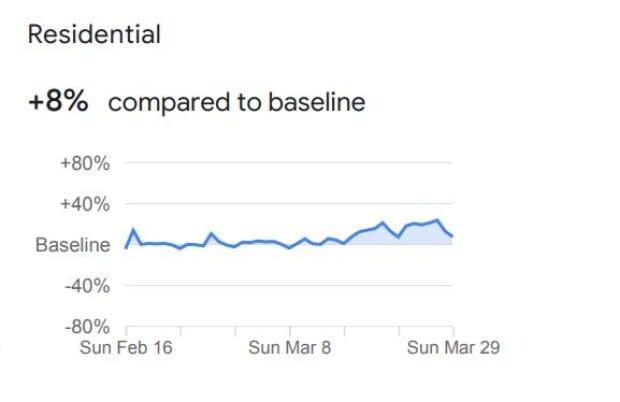
The residential category has shown a modest increase of eight per cent.
Google noted that the data included depends on user settings, connectivity, and whether it meets our privacy threshold. It noted that when the threshold isn't met — for example, if someone isn't "busy enough" to ensure anonymity, it doesn't show a change for that day.

Transit stations, which includes bus and train stations, recorded the largest decline, at 47 per cent, compared to the baseline time period. That drop began around March 16.
VIA Rail halted its passenger train service through the province. The province's major cities have made changes to transit service in recent weeks.
For example, Codiac Transpo in the Moncton region, has reduced transit hours, limited buses to six passengers and cut Sunday service.
