
Here's What China MeiDong Auto Holdings Limited's (HKG:1268) ROCE Can Tell Us

Today we'll evaluate China MeiDong Auto Holdings Limited (HKG:1268) to determine whether it could have potential as an investment idea. Specifically, we'll consider its Return On Capital Employed (ROCE), since that will give us an insight into how efficiently the business can generate profits from the capital it requires.
First up, we'll look at what ROCE is and how we calculate it. Next, we'll compare it to others in its industry. And finally, we'll look at how its current liabilities are impacting its ROCE.
Return On Capital Employed (ROCE): What is it?
ROCE measures the 'return' (pre-tax profit) a company generates from capital employed in its business. All else being equal, a better business will have a higher ROCE. In brief, it is a useful tool, but it is not without drawbacks. Author Edwin Whiting says to be careful when comparing the ROCE of different businesses, since 'No two businesses are exactly alike.
So, How Do We Calculate ROCE?
Analysts use this formula to calculate return on capital employed:
Return on Capital Employed = Earnings Before Interest and Tax (EBIT) ÷ (Total Assets - Current Liabilities)
Or for China MeiDong Auto Holdings:
0.30 = CN¥837m ÷ (CN¥5.9b - CN¥3.2b) (Based on the trailing twelve months to December 2019.)
So, China MeiDong Auto Holdings has an ROCE of 30%.
View our latest analysis for China MeiDong Auto Holdings
Does China MeiDong Auto Holdings Have A Good ROCE?
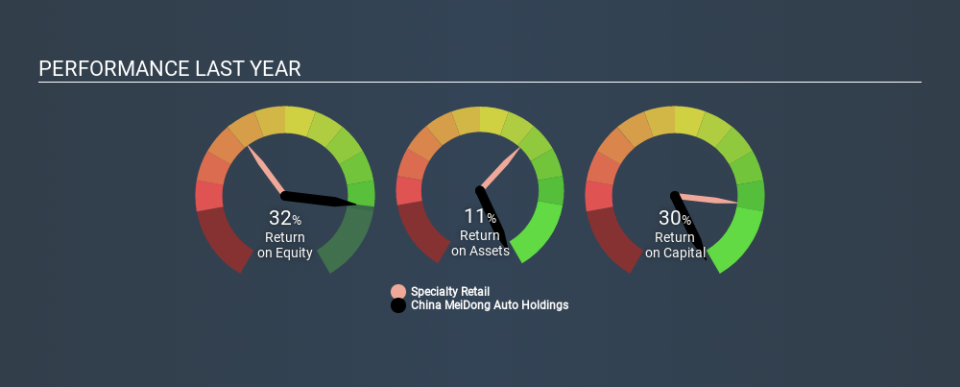
ROCE is commonly used for comparing the performance of similar businesses. In our analysis, China MeiDong Auto Holdings's ROCE is meaningfully higher than the 12% average in the Specialty Retail industry. I think that's good to see, since it implies the company is better than other companies at making the most of its capital. Setting aside the comparison to its industry for a moment, China MeiDong Auto Holdings's ROCE in absolute terms currently looks quite high.
In our analysis, China MeiDong Auto Holdings's ROCE appears to be 30%, compared to 3 years ago, when its ROCE was 24%. This makes us think about whether the company has been reinvesting shrewdly. The image below shows how China MeiDong Auto Holdings's ROCE compares to its industry, and you can click it to see more detail on its past growth.
Remember that this metric is backwards looking - it shows what has happened in the past, and does not accurately predict the future. ROCE can be misleading for companies in cyclical industries, with returns looking impressive during the boom times, but very weak during the busts. ROCE is only a point-in-time measure. Since the future is so important for investors, you should check out our free report on analyst forecasts for China MeiDong Auto Holdings.
Do China MeiDong Auto Holdings's Current Liabilities Skew Its ROCE?
Current liabilities are short term bills and invoices that need to be paid in 12 months or less. Due to the way ROCE is calculated, a high level of current liabilities makes a company look as though it has less capital employed, and thus can (sometimes unfairly) boost the ROCE. To counter this, investors can check if a company has high current liabilities relative to total assets.
China MeiDong Auto Holdings has current liabilities of CN¥3.2b and total assets of CN¥5.9b. As a result, its current liabilities are equal to approximately 54% of its total assets. China MeiDong Auto Holdings's high level of current liabilities boost the ROCE - but its ROCE is still impressive.
What We Can Learn From China MeiDong Auto Holdings's ROCE
So to us, the company is potentially worth investigating further. China MeiDong Auto Holdings looks strong on this analysis, but there are plenty of other companies that could be a good opportunity . Here is a free list of companies growing earnings rapidly.
If you are like me, then you will not want to miss this free list of growing companies that insiders are buying.
If you spot an error that warrants correction, please contact the editor at editorial-team@simplywallst.com. This article by Simply Wall St is general in nature. It does not constitute a recommendation to buy or sell any stock, and does not take account of your objectives, or your financial situation. Simply Wall St has no position in the stocks mentioned.
We aim to bring you long-term focused research analysis driven by fundamental data. Note that our analysis may not factor in the latest price-sensitive company announcements or qualitative material. Thank you for reading.

