
Here's What Novavest Real Estate AG's (VTX:NREN) P/E Is Telling Us

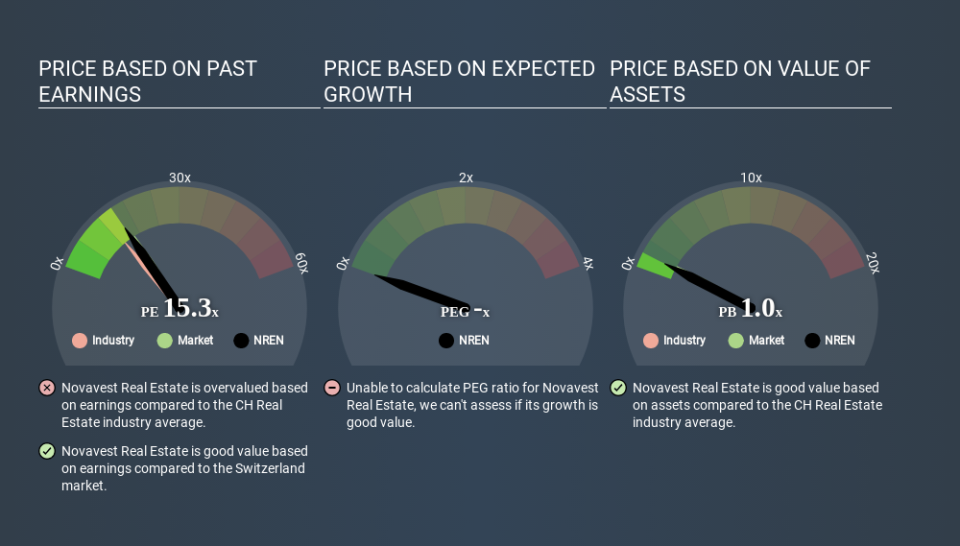
The goal of this article is to teach you how to use price to earnings ratios (P/E ratios). We'll look at Novavest Real Estate AG's (VTX:NREN) P/E ratio and reflect on what it tells us about the company's share price. Based on the last twelve months, Novavest Real Estate's P/E ratio is 15.30. That is equivalent to an earnings yield of about 6.5%.
View our latest analysis for Novavest Real Estate
How Do I Calculate A Price To Earnings Ratio?
The formula for price to earnings is:
Price to Earnings Ratio = Price per Share ÷ Earnings per Share (EPS)
Or for Novavest Real Estate:
P/E of 15.30 = CHF42.000 ÷ CHF2.745 (Based on the year to December 2019.)
(Note: the above calculation results may not be precise due to rounding.)
Is A High Price-to-Earnings Ratio Good?
A higher P/E ratio implies that investors pay a higher price for the earning power of the business. All else being equal, it's better to pay a low price -- but as Warren Buffett said, 'It's far better to buy a wonderful company at a fair price than a fair company at a wonderful price'.
Does Novavest Real Estate Have A Relatively High Or Low P/E For Its Industry?
We can get an indication of market expectations by looking at the P/E ratio. As you can see below, Novavest Real Estate has a higher P/E than the average company (13.0) in the real estate industry.
Its relatively high P/E ratio indicates that Novavest Real Estate shareholders think it will perform better than other companies in its industry classification. Shareholders are clearly optimistic, but the future is always uncertain. So further research is always essential. I often monitor director buying and selling.
How Growth Rates Impact P/E Ratios
P/E ratios primarily reflect market expectations around earnings growth rates. When earnings grow, the 'E' increases, over time. That means unless the share price increases, the P/E will reduce in a few years. Then, a lower P/E should attract more buyers, pushing the share price up.
It's great to see that Novavest Real Estate grew EPS by 18% in the last year. And it has bolstered its earnings per share by 11% per year over the last five years. So one might expect an above average P/E ratio.
A Limitation: P/E Ratios Ignore Debt and Cash In The Bank
The 'Price' in P/E reflects the market capitalization of the company. That means it doesn't take debt or cash into account. Hypothetically, a company could reduce its future P/E ratio by spending its cash (or taking on debt) to achieve higher earnings.
While growth expenditure doesn't always pay off, the point is that it is a good option to have; but one that the P/E ratio ignores.
Is Debt Impacting Novavest Real Estate's P/E?
Novavest Real Estate's net debt is considerable, at 104% of its market cap. If you want to compare its P/E ratio to other companies, you must keep in mind that these debt levels would usually warrant a relatively low P/E.
The Bottom Line On Novavest Real Estate's P/E Ratio
Novavest Real Estate has a P/E of 15.3. That's around the same as the average in the CH market, which is 16.5. While it does have meaningful debt levels, it has also produced strong earnings growth recently. However, the P/E ratio implies that most doubt the strong growth will continue.
Investors should be looking to buy stocks that the market is wrong about. If it is underestimating a company, investors can make money by buying and holding the shares until the market corrects itself. We don't have analyst forecasts, but shareholders might want to examine this detailed historical graph of earnings, revenue and cash flow.
Of course, you might find a fantastic investment by looking at a few good candidates. So take a peek at this free list of companies with modest (or no) debt, trading on a P/E below 20.
If you spot an error that warrants correction, please contact the editor at editorial-team@simplywallst.com. This article by Simply Wall St is general in nature. It does not constitute a recommendation to buy or sell any stock, and does not take account of your objectives, or your financial situation. Simply Wall St has no position in the stocks mentioned.
We aim to bring you long-term focused research analysis driven by fundamental data. Note that our analysis may not factor in the latest price-sensitive company announcements or qualitative material. Thank you for reading.

