
What Is Information Services Group's (NASDAQ:III) P/E Ratio After Its Share Price Tanked?

Unfortunately for some shareholders, the Information Services Group (NASDAQ:III) share price has dived 32% in the last thirty days. Indeed the recent decline has arguably caused some bitterness for shareholders who have held through the 48% drop over twelve months.
All else being equal, a share price drop should make a stock more attractive to potential investors. While the market sentiment towards a stock is very changeable, in the long run, the share price will tend to move in the same direction as earnings per share. The implication here is that long term investors have an opportunity when expectations of a company are too low. One way to gauge market expectations of a stock is to look at its Price to Earnings Ratio (PE Ratio). A high P/E implies that investors have high expectations of what a company can achieve compared to a company with a low P/E ratio.
View our latest analysis for Information Services Group
Does Information Services Group Have A Relatively High Or Low P/E For Its Industry?
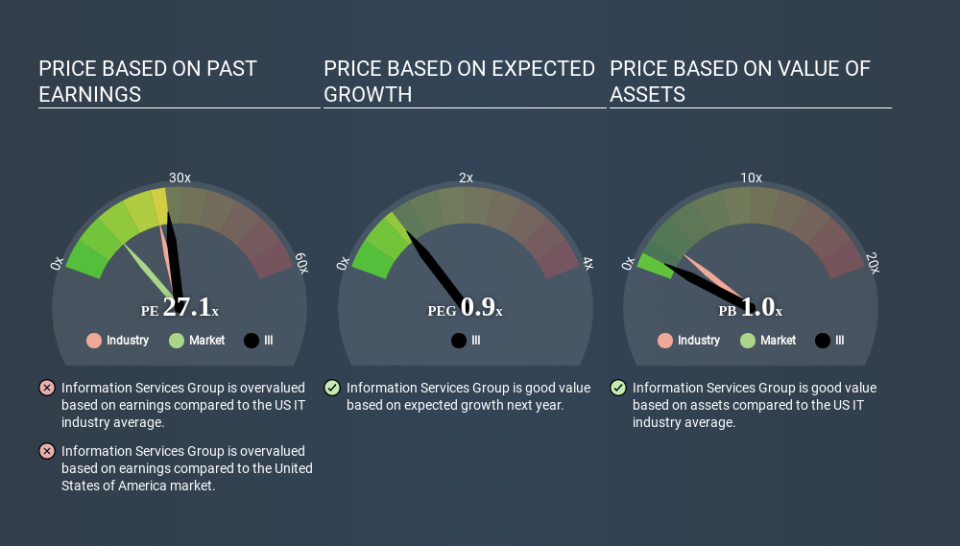
We can tell from its P/E ratio of 27.10 that there is some investor optimism about Information Services Group. As you can see below, Information Services Group has a higher P/E than the average company (24.3) in the it industry.
Its relatively high P/E ratio indicates that Information Services Group shareholders think it will perform better than other companies in its industry classification. The market is optimistic about the future, but that doesn't guarantee future growth. So investors should delve deeper. I like to check if company insiders have been buying or selling.
How Growth Rates Impact P/E Ratios
P/E ratios primarily reflect market expectations around earnings growth rates. Earnings growth means that in the future the 'E' will be higher. That means even if the current P/E is high, it will reduce over time if the share price stays flat. A lower P/E should indicate the stock is cheap relative to others -- and that may attract buyers.
Information Services Group's earnings per share fell by 44% in the last twelve months. And EPS is down 16% a year, over the last 5 years. This could justify a pessimistic P/E.
Remember: P/E Ratios Don't Consider The Balance Sheet
Don't forget that the P/E ratio considers market capitalization. Thus, the metric does not reflect cash or debt held by the company. In theory, a company can lower its future P/E ratio by using cash or debt to invest in growth.
While growth expenditure doesn't always pay off, the point is that it is a good option to have; but one that the P/E ratio ignores.
So What Does Information Services Group's Balance Sheet Tell Us?
Information Services Group has net debt worth 75% of its market capitalization. This is a reasonably significant level of debt -- all else being equal you'd expect a much lower P/E than if it had net cash.
The Verdict On Information Services Group's P/E Ratio
Information Services Group trades on a P/E ratio of 27.1, which is above its market average of 12.5. With significant debt and no EPS growth last year, shareholders are betting on an improvement in earnings from the company. What can be absolutely certain is that the market has become significantly less optimistic about Information Services Group over the last month, with the P/E ratio falling from 39.9 back then to 27.1 today. For those who prefer to invest with the flow of momentum, that might be a bad sign, but for a contrarian, it may signal opportunity.
Investors have an opportunity when market expectations about a stock are wrong. As value investor Benjamin Graham famously said, 'In the short run, the market is a voting machine but in the long run, it is a weighing machine. So this free report on the analyst consensus forecasts could help you make a master move on this stock.
But note: Information Services Group may not be the best stock to buy. So take a peek at this free list of interesting companies with strong recent earnings growth (and a P/E ratio below 20).
If you spot an error that warrants correction, please contact the editor at editorial-team@simplywallst.com. This article by Simply Wall St is general in nature. It does not constitute a recommendation to buy or sell any stock, and does not take account of your objectives, or your financial situation. Simply Wall St has no position in the stocks mentioned.
We aim to bring you long-term focused research analysis driven by fundamental data. Note that our analysis may not factor in the latest price-sensitive company announcements or qualitative material. Thank you for reading.

