
Pro Medicus Limited's (ASX:PME) Stock Has Been Sliding But Fundamentals Look Strong: Is The Market Wrong?

It is hard to get excited after looking at Pro Medicus' (ASX:PME) recent performance, when its stock has declined 8.9% over the past month. However, stock prices are usually driven by a company’s financial performance over the long term, which in this case looks quite promising. Specifically, we decided to study Pro Medicus' ROE in this article.
Return on equity or ROE is an important factor to be considered by a shareholder because it tells them how effectively their capital is being reinvested. In short, ROE shows the profit each dollar generates with respect to its shareholder investments.
See our latest analysis for Pro Medicus
How Do You Calculate Return On Equity?
Return on equity can be calculated by using the formula:
Return on Equity = Net Profit (from continuing operations) ÷ Shareholders' Equity
So, based on the above formula, the ROE for Pro Medicus is:
42% = AU$22m ÷ AU$52m (Based on the trailing twelve months to December 2019).
The 'return' is the income the business earned over the last year. That means that for every A$1 worth of shareholders' equity, the company generated A$0.42 in profit.
What Is The Relationship Between ROE And Earnings Growth?
We have already established that ROE serves as an efficient profit-generating gauge for a company's future earnings. Based on how much of its profits the company chooses to reinvest or "retain", we are then able to evaluate a company's future ability to generate profits. Generally speaking, other things being equal, firms with a high return on equity and profit retention, have a higher growth rate than firms that don’t share these attributes.
A Side By Side comparison of Pro Medicus' Earnings Growth And 42% ROE
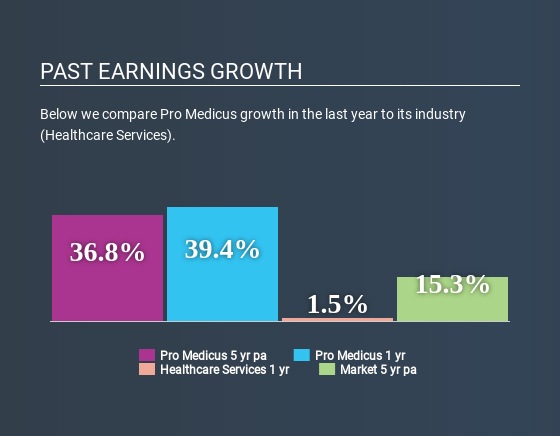
Firstly, we acknowledge that Pro Medicus has a significantly high ROE. Second, a comparison with the average ROE reported by the industry of 12% also doesn't go unnoticed by us. Under the circumstances, Pro Medicus' considerable five year net income growth of 37% was to be expected.
Next, on comparing Pro Medicus' net income growth with the industry, we found that the company's reported growth is similar to the industry average growth rate of 37% in the same period.
The basis for attaching value to a company is, to a great extent, tied to its earnings growth. It’s important for an investor to know whether the market has priced in the company's expected earnings growth (or decline). This then helps them determine if the stock is placed for a bright or bleak future. If you're wondering about Pro Medicus''s valuation, check out this gauge of its price-to-earnings ratio, as compared to its industry.
Is Pro Medicus Using Its Retained Earnings Effectively?
Pro Medicus' three-year median payout ratio is a pretty moderate 47%, meaning the company retains 53% of its income. By the looks of it, the dividend is well covered and Pro Medicus is reinvesting its profits efficiently as evidenced by its exceptional growth which we discussed above.
Additionally, Pro Medicus has paid dividends over a period of at least ten years which means that the company is pretty serious about sharing its profits with shareholders. Our latest analyst data shows that the future payout ratio of the company over the next three years is expected to be approximately 49%. As a result, Pro Medicus' ROE is not expected to change by much either, which we inferred from the analyst estimate of 47% for future ROE.
Conclusion
Overall, we are quite pleased with Pro Medicus' performance. Specifically, we like that the company is reinvesting a huge chunk of its profits at a high rate of return. This of course has caused the company to see substantial growth in its earnings. That being so, a study of the latest analyst forecasts show that the company is expected to see a slowdown in its future earnings growth. To know more about the latest analysts predictions for the company, check out this visualization of analyst forecasts for the company.
This article by Simply Wall St is general in nature. It does not constitute a recommendation to buy or sell any stock, and does not take account of your objectives, or your financial situation. We aim to bring you long-term focused analysis driven by fundamental data. Note that our analysis may not factor in the latest price-sensitive company announcements or qualitative material. Simply Wall St has no position in any stocks mentioned.
Have feedback on this article? Concerned about the content? Get in touch with us directly. Alternatively, email editorial-team@simplywallst.com.

