
River level predictions: How they stacked up with reality

Nearly a week before the St. John River overflowed into the streets of Fredericton, Brent Newton knew trouble was coming.
As a flow and flood forecast engineer with the Department of Environment and Local Government, Newton is asked to look into the river's future.
By April 22, that future began to look alarming.
That's when Newton's five-day forecast suggested Fredericton would shoot past flood stage of 6.5 metres on April 27.
Newton was skeptical at first.
"You don't always know if you believe the fifth day," Newton said.
The five-day St. John River forecasts issued during River Watch are built from a number of factors. Some, like weather, can be hard to predict with accuracy five days into the future.
"It can be frustrating," Newton said.
"We talk to the best weather guys in Dartmouth at the Atlantic Storm Prediction Centre. It's still a challenge."
'Oh, geez, this is coming'
But the forecast held on April 23. And then it held again on April 24.
"Then everyone starts to say, 'Oh, geez, this is coming,'" Newton said.
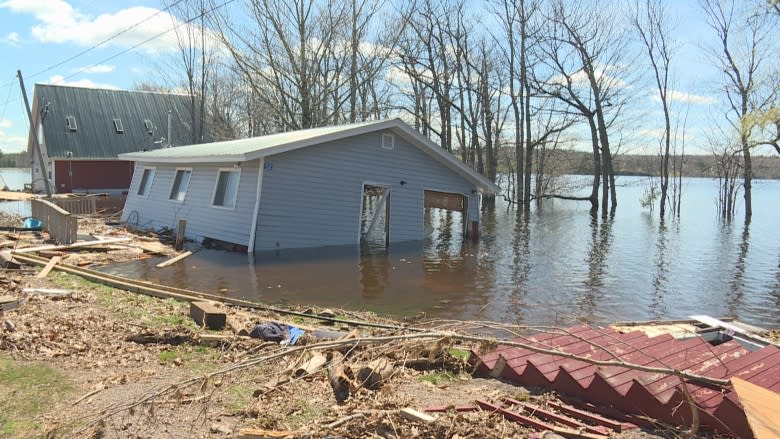
When the river spilled, the water came faster than anyone, including Newton, expected.
On April 26, the forecast predicted the St. John River at Fredericton would rise to 6.9 metres the next day, edging past flood stage.
But by 7 a.m. on April 27, the river rose all the way to 7.8 metres.
It was an increase of nearly two full metres in just 24 hours.
"Once it started to come, it did come really fast," Newton said.
"It caught us by surprise, the amount of rain. We got more rain than we were forecasting in the upper basin."
How the predictions are made
Anyone can monitor real-time water levels at several gauges along the St. John River through Environment Canada's website.
But how do you look into the future and predict how high the water will rise?
Newton uses something called a hydrologic model to determine how much snow will melt and how the water will flow.
It takes into account a number of factors, including temperature, precipitation and something called snow water equivalent.
The snow water equivalent information comes from snow surveys. Engineers go out and take snow samples at different sites to determine how much water is in the snow.
"We're not so concerned with depth," Newton said.
"It's more the water that's going to run off and what's left to run off."
Newton and other staff model the flow at 66 different sub-basins on the river.
That information on water flows is fed into what Newton calls a hydraulic model.
Using complex equations, it tells Newton what the water levels will be at different locations based on the flow information.
"The model is an older model that we use, but it works so well," he said.
A tricky business
Looking back, Newton can see how things could have been different.
If the weather had been warmer at the beginning of April, the snow might have melted faster.
That could have prevented a deluge of snow melting all at once.
Even if the temperature stayed the same in early April, the major flooding could have still been avoided if the weather didn't warm up so quickly later in the month, Newton said, or if it rained less.
"It ended up being a unique event in that way," he said.
Newton has turned his focus to examining his predictions and how accurate they were.
A CBC News analysis of the forecasts suggest the predictions were accurate on most days.
The outlier is April 27, the day the water came faster than anyone imagined.
"It's a tricky business when you're forecasting water levels based on a flow forecast, when the flow forecast is based on a weather forecast," Newton said.
Here's a look at each community, what was predicted and what actually happened:
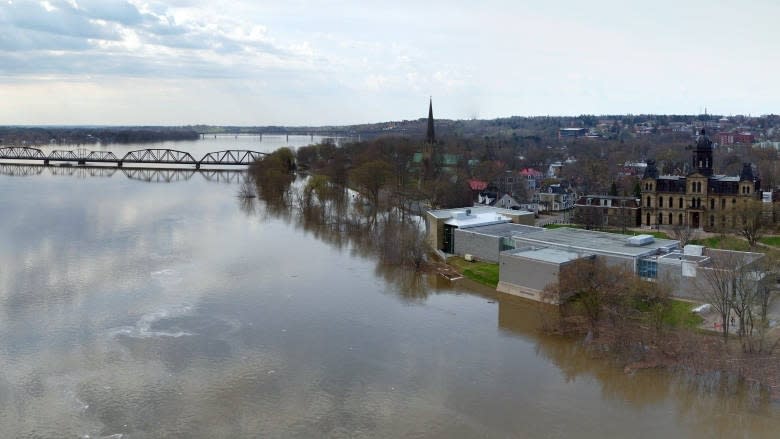
Fredericton
Flood stage: 6.5 metres
When the river hit flood stage (as of 7 a.m.): April 27
Forecast for April 27: 6.9 metres
Actual water level: 7.8 metres
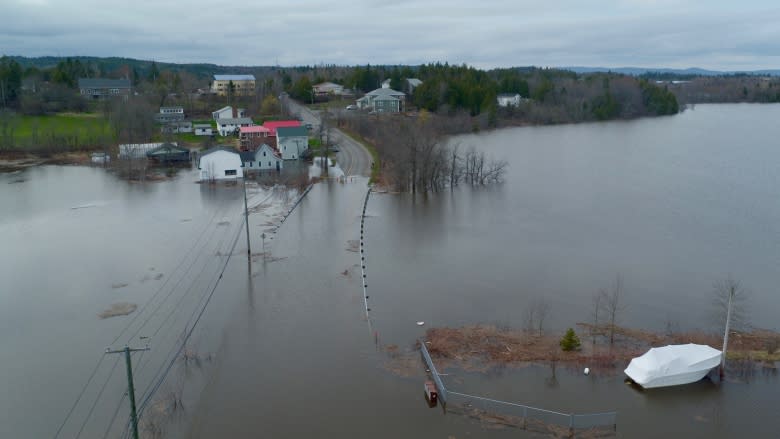
Maugerville
Flood stage: 6 metres
When the river hit flood stage (as of 7 a.m.): April 27
Forecast for April 27: 5.6 metres
Actual water level: 6.1 metres
Jemseg
Flood stage: 4.3 metres
When the river hit flood stage (as of 7 a.m.): April 28
Forecast for April 28: 4.7 metres
Actual water level: 4.5 metres
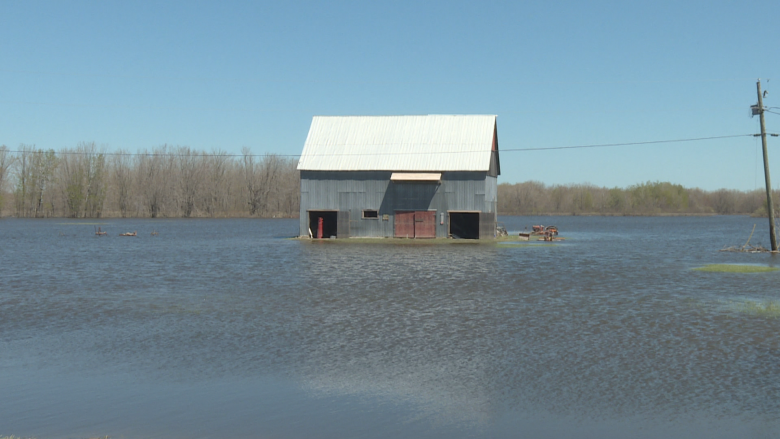
Grand Lake
Flood stage: 5 metres
When the river hit flood stage (as of 7 a.m.): April 29
Forecast for April 29: 4.9 metres
Actual water level: 5.2 metres
Sheffield/Lakeville Corner
Flood stage: 4.8 metres
When the river hit flood stage (as of 7 a.m.): April 29
Forecast for April 29: 5.1 metres
Actual water level: 5.7 metres
Oak Point
Flood stage: 4.7 metres
When the river hit flood stage (as of 7 a.m.): April 30
Forecast for April 30: 4.6 metres
Actual water level: 4.76 metres
Saint John/Quispamsis
Flood stage: 4.2 metres
When the river hit flood stage (as of 7 a.m.): April 30
Forecast for April 30: 4.4 metres
Actual water level: 4.4 metres
Note: Actual water level measurements taken daily at 7 a.m. from Environment Canada.
