
Seaboard Corporation (NYSEMKT:SEB) Might Not Be A Great Investment

Today we'll look at Seaboard Corporation (NYSEMKT:SEB) and reflect on its potential as an investment. Specifically, we'll consider its Return On Capital Employed (ROCE), since that will give us an insight into how efficiently the business can generate profits from the capital it requires.
First, we'll go over how we calculate ROCE. Then we'll compare its ROCE to similar companies. Last but not least, we'll look at what impact its current liabilities have on its ROCE.
What is Return On Capital Employed (ROCE)?
ROCE is a measure of a company's yearly pre-tax profit (its return), relative to the capital employed in the business. All else being equal, a better business will have a higher ROCE. Ultimately, it is a useful but imperfect metric. Renowned investment researcher Michael Mauboussin has suggested that a high ROCE can indicate that 'one dollar invested in the company generates value of more than one dollar'.
So, How Do We Calculate ROCE?
The formula for calculating the return on capital employed is:
Return on Capital Employed = Earnings Before Interest and Tax (EBIT) ÷ (Total Assets - Current Liabilities)
Or for Seaboard:
0.019 = US$95m ÷ (US$6.3b - US$1.2b) (Based on the trailing twelve months to December 2019.)
Therefore, Seaboard has an ROCE of 1.9%.
View our latest analysis for Seaboard
Is Seaboard's ROCE Good?
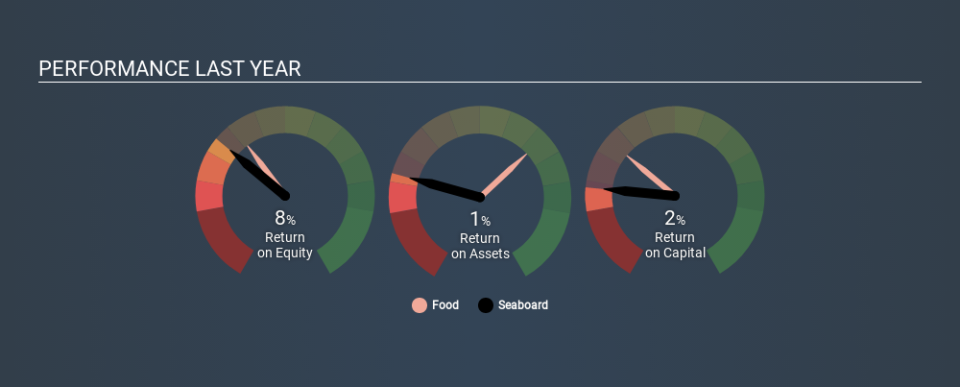
When making comparisons between similar businesses, investors may find ROCE useful. In this analysis, Seaboard's ROCE appears meaningfully below the 8.7% average reported by the Food industry. This could be seen as a negative, as it suggests some competitors may be employing their capital more efficiently. Independently of how Seaboard compares to its industry, its ROCE in absolute terms is low; especially compared to the ~1.7% available in government bonds. It is likely that there are more attractive prospects out there.
Seaboard's current ROCE of 1.9% is lower than its ROCE in the past, which was 6.0%, 3 years ago. So investors might consider if it has had issues recently. You can see in the image below how Seaboard's ROCE compares to its industry. Click to see more on past growth.
When considering ROCE, bear in mind that it reflects the past and does not necessarily predict the future. Companies in cyclical industries can be difficult to understand using ROCE, as returns typically look high during boom times, and low during busts. ROCE is, after all, simply a snap shot of a single year. You can check if Seaboard has cyclical profits by looking at this free graph of past earnings, revenue and cash flow.
Seaboard's Current Liabilities And Their Impact On Its ROCE
Current liabilities are short term bills and invoices that need to be paid in 12 months or less. Due to the way the ROCE equation works, having large bills due in the near term can make it look as though a company has less capital employed, and thus a higher ROCE than usual. To counteract this, we check if a company has high current liabilities, relative to its total assets.
Seaboard has total assets of US$6.3b and current liabilities of US$1.2b. As a result, its current liabilities are equal to approximately 19% of its total assets. With a very reasonable level of current liabilities, so the impact on ROCE is fairly minimal.
What We Can Learn From Seaboard's ROCE
Seaboard has a poor ROCE, and there may be better investment prospects out there. But note: make sure you look for a great company, not just the first idea you come across. So take a peek at this free list of interesting companies with strong recent earnings growth (and a P/E ratio below 20).
If you are like me, then you will not want to miss this free list of growing companies that insiders are buying.
If you spot an error that warrants correction, please contact the editor at editorial-team@simplywallst.com. This article by Simply Wall St is general in nature. It does not constitute a recommendation to buy or sell any stock, and does not take account of your objectives, or your financial situation. Simply Wall St has no position in the stocks mentioned.
We aim to bring you long-term focused research analysis driven by fundamental data. Note that our analysis may not factor in the latest price-sensitive company announcements or qualitative material. Thank you for reading.
