
Search for Metro Vancouver's best neighbourhood: Fraser River and Northern semifinals
The original 192 neighbourhoods in our search for Metro Vancouver's best neighbourhood came in all shapes and sizes.
But as we get down to the final 16, there are some similarities between the finalists.
Of the 12 finalists outside the City of Vancouver, 10 have an average age higher than 41, the overall average for Metro Vancouver.
All but one — Upper Deer Lake — have a smaller percentage of visible minorities than the region's average of 49 per cent.
And all 12 have an average total household income higher than the Metro Vancouver average of $96,400, with Deep Cove's at double that.
Whether a result of who is voting in the polls, planning decisions made decades ago influencing what neighbourhoods people like most, or other factors, it's something to consider.
Friday, Aug. 7 sees voting in the semifinals for both Fraser River and the Northern quadrants, as we go from four to just two neighbourhoods in both sections.
The Fraser River final will be on Aug. 12, with the Northern final on Aug. 13.
Today though, you decide what neighbourhoods will be in the final.

Burnaby and New West/Richmond finals

Steveston:
Average age: 43.
Average total household income: $105,000.
Visible minorities as a percentage of neighbourhood population: 43%.
Road to the Sweet Sixteen: First Round Bye, Defeated Seafair 93-7%, Thompson 94-6% and Garden City 94-6%.
Queen's Park:
Average age (approx.): 40.
Average total household income (approx.): $130,000.
Visible minorities as a percentage of neighbourhood population (approx.): 24%.
Road to the Sweet Sixteen: First Round Bye, Defeated Brow of the Hill 75-25%, Sapperton/McBride 68-32% and Quayside 58-42%.
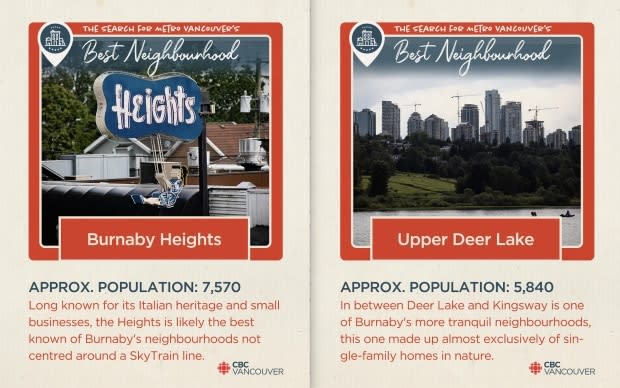
Upper Deer Lake:
Average age (approx.): 41.
Average total household income (approx.): $100,000.
Visible minorities as a percentage of neighbourhood population (approx.): 67%.
Road to the Sweet Sixteen: Defeated Douglas-Gilpin 87-13%, Buckingham Heights 79-21%, Metrotown 71-29% and South Slope 67-33%.
Burnaby Heights:
Average age: 44.
Average total household income: $101,000.
Visible minorities as a percentage of neighbourhood population: 38%.
Road to the Sweet Sixteen: First Round Bye, Defeated Willingdon Heights 77-23%, Brentwood 78-22% and Capitol Hill 75-25%.
Northern finals


Lions Bay:
Average age: 45.
Average total household income: $159,000.
Visible minorities as a percentage of neighbourhood population: 10%.
Road to the Sweet Sixteen: Defeated Eagle Ridge 65-35%, Coquitlam City Centre 65-35%, Burke Mountain 59-41% and Anmore 53-47%.
Pitt Meadows:
Average age: 41.
Average total household income: $98,900.
Visible minorities as a percentage of neighbourhood population: 19%.
Road to the Sweet Sixteen: Defeated Oxford Heights 63-37%, Glenwood 64-36%, Downtown Port Coquitlam 60-40% and Belcarra 50.3-49.7%.

Lynn Valley:
Average age (approx.): 40.
Average total household income (approx.): $125,000.
Visible minorities as a percentage of neighbourhood population (approx.): 24%.
Road to the Sweet Sixteen: First Round Bye, defeated Capilano/Edgemont 59-41%, Lower Lonsdale 53-47% and Ambleside 51-49%.
Deep Cove:
Average age (approx.): 42.
Average total household income (approx.): $170,000.
Visible minorities as a percentage of neighbourhood population (approx.): 15%.
Road to the Sweet Sixteen: First Round Bye, defeated Bowen Island 58-42%, Haney 89-11% and Silver Valley 88-12%.
*Approximate figures given when neighbourhood boundaries don't correlate exactly to census tracts.
