
What Is Storebrand's (OB:STB) P/E Ratio After Its Share Price Tanked?

Unfortunately for some shareholders, the Storebrand (OB:STB) share price has dived 37% in the last thirty days. That drop has capped off a tough year for shareholders, with the share price down 40% in that time.
All else being equal, a share price drop should make a stock more attractive to potential investors. While the market sentiment towards a stock is very changeable, in the long run, the share price will tend to move in the same direction as earnings per share. So, on certain occasions, long term focussed investors try to take advantage of pessimistic expectations to buy shares at a better price. Perhaps the simplest way to get a read on investors' expectations of a business is to look at its Price to Earnings Ratio (PE Ratio). Investors have optimistic expectations of companies with higher P/E ratios, compared to companies with lower P/E ratios.
View our latest analysis for Storebrand
How Does Storebrand's P/E Ratio Compare To Its Peers?
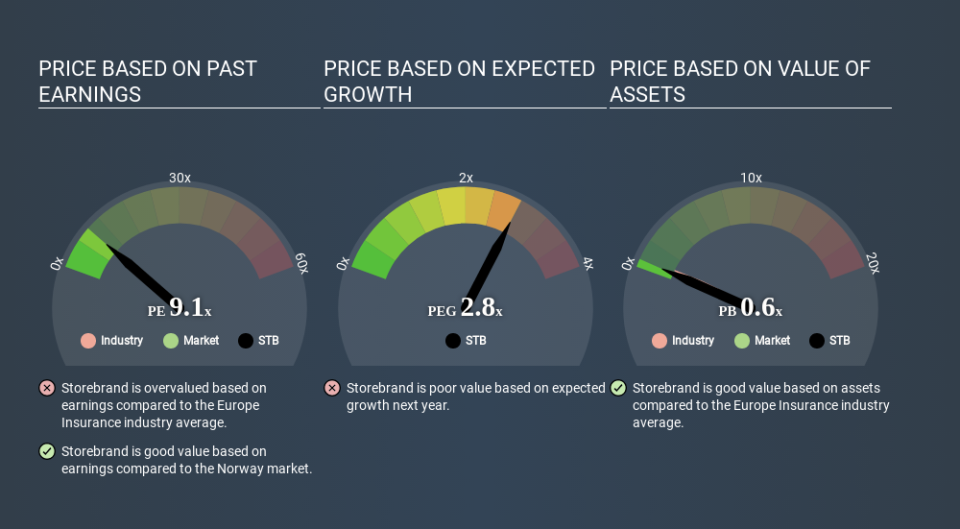
Storebrand has a P/E ratio of 9.06. As you can see below Storebrand has a P/E ratio that is fairly close for the average for the insurance industry, which is 8.8.
Its P/E ratio suggests that Storebrand shareholders think that in the future it will perform about the same as other companies in its industry classification. So if Storebrand actually outperforms its peers going forward, that should be a positive for the share price. Further research into factors such as insider buying and selling, could help you form your own view on whether that is likely.
How Growth Rates Impact P/E Ratios
If earnings fall then in the future the 'E' will be lower. That means even if the current P/E is low, it will increase over time if the share price stays flat. So while a stock may look cheap based on past earnings, it could be expensive based on future earnings.
Storebrand's earnings per share fell by 44% in the last twelve months. And over the longer term (3 years) earnings per share have decreased 2.1% annually. This could justify a low P/E.
Remember: P/E Ratios Don't Consider The Balance Sheet
One drawback of using a P/E ratio is that it considers market capitalization, but not the balance sheet. In other words, it does not consider any debt or cash that the company may have on the balance sheet. In theory, a company can lower its future P/E ratio by using cash or debt to invest in growth.
Such expenditure might be good or bad, in the long term, but the point here is that the balance sheet is not reflected by this ratio.
How Does Storebrand's Debt Impact Its P/E Ratio?
Storebrand's net debt is considerable, at 133% of its market cap. This level of debt justifies a relatively low P/E, so remain cognizant of the debt, if you're comparing it to other stocks.
The Bottom Line On Storebrand's P/E Ratio
Storebrand trades on a P/E ratio of 9.1, which is fairly close to the NO market average of 9.6. With meaningful debt, and no earnings per share growth last year, even an average P/E indicates that the market a significant improvement from the business. What can be absolutely certain is that the market has become more pessimistic about Storebrand over the last month, with the P/E ratio falling from 14.3 back then to 9.1 today. For those who prefer to invest with the flow of momentum, that might be a bad sign, but for deep value investors this stock might justify some research.
Investors have an opportunity when market expectations about a stock are wrong. If the reality for a company is not as bad as the P/E ratio indicates, then the share price should increase as the market realizes this. So this free visual report on analyst forecasts could hold the key to an excellent investment decision.
Of course, you might find a fantastic investment by looking at a few good candidates. So take a peek at this free list of companies with modest (or no) debt, trading on a P/E below 20.
If you spot an error that warrants correction, please contact the editor at editorial-team@simplywallst.com. This article by Simply Wall St is general in nature. It does not constitute a recommendation to buy or sell any stock, and does not take account of your objectives, or your financial situation. Simply Wall St has no position in the stocks mentioned.
We aim to bring you long-term focused research analysis driven by fundamental data. Note that our analysis may not factor in the latest price-sensitive company announcements or qualitative material. Thank you for reading.
