
Universal Star (Holdings) Limited (HKG:2346) Earns A Nice Return On Capital Employed

Today we are going to look at Universal Star (Holdings) Limited (HKG:2346) to see whether it might be an attractive investment prospect. To be precise, we'll consider its Return On Capital Employed (ROCE), as that will inform our view of the quality of the business.
Firstly, we'll go over how we calculate ROCE. Next, we'll compare it to others in its industry. And finally, we'll look at how its current liabilities are impacting its ROCE.
Return On Capital Employed (ROCE): What is it?
ROCE is a metric for evaluating how much pre-tax income (in percentage terms) a company earns on the capital invested in its business. All else being equal, a better business will have a higher ROCE. Overall, it is a valuable metric that has its flaws. Renowned investment researcher Michael Mauboussin has suggested that a high ROCE can indicate that 'one dollar invested in the company generates value of more than one dollar'.
How Do You Calculate Return On Capital Employed?
The formula for calculating the return on capital employed is:
Return on Capital Employed = Earnings Before Interest and Tax (EBIT) ÷ (Total Assets - Current Liabilities)
Or for Universal Star (Holdings):
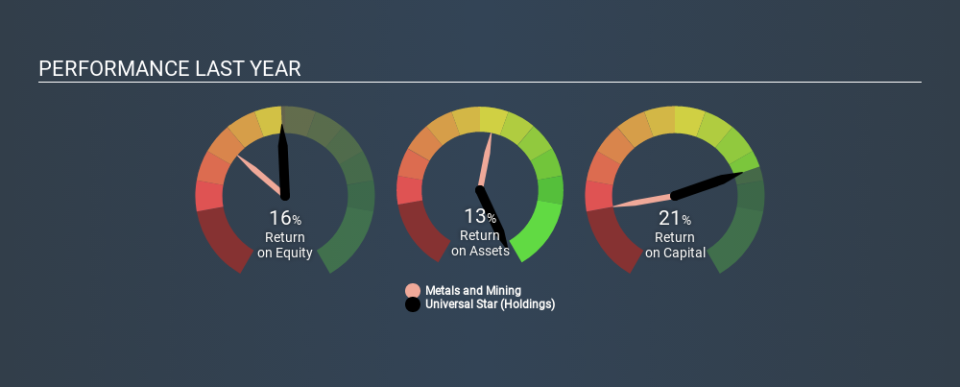
0.21 = CN¥68m ÷ (CN¥425m - CN¥92m) (Based on the trailing twelve months to June 2019.)
Therefore, Universal Star (Holdings) has an ROCE of 21%.
Check out our latest analysis for Universal Star (Holdings)
Is Universal Star (Holdings)'s ROCE Good?
When making comparisons between similar businesses, investors may find ROCE useful. In our analysis, Universal Star (Holdings)'s ROCE is meaningfully higher than the 7.8% average in the Metals and Mining industry. We would consider this a positive, as it suggests it is using capital more effectively than other similar companies. Putting aside its position relative to its industry for now, in absolute terms, Universal Star (Holdings)'s ROCE is currently very good.
The image below shows how Universal Star (Holdings)'s ROCE compares to its industry, and you can click it to see more detail on its past growth.
It is important to remember that ROCE shows past performance, and is not necessarily predictive. ROCE can be misleading for companies in cyclical industries, with returns looking impressive during the boom times, but very weak during the busts. ROCE is, after all, simply a snap shot of a single year. Remember that most companies like Universal Star (Holdings) are cyclical businesses. How cyclical is Universal Star (Holdings)? You can see for yourself by looking at this free graph of past earnings, revenue and cash flow.
How Universal Star (Holdings)'s Current Liabilities Impact Its ROCE
Current liabilities are short term bills and invoices that need to be paid in 12 months or less. Due to the way the ROCE equation works, having large bills due in the near term can make it look as though a company has less capital employed, and thus a higher ROCE than usual. To counteract this, we check if a company has high current liabilities, relative to its total assets.
Universal Star (Holdings) has total assets of CN¥425m and current liabilities of CN¥92m. Therefore its current liabilities are equivalent to approximately 22% of its total assets. This is quite a low level of current liabilities which would not greatly boost the already high ROCE.
The Bottom Line On Universal Star (Holdings)'s ROCE
Low current liabilities and high ROCE is a good combination, making Universal Star (Holdings) look quite interesting. Universal Star (Holdings) looks strong on this analysis, but there are plenty of other companies that could be a good opportunity . Here is a free list of companies growing earnings rapidly.
I will like Universal Star (Holdings) better if I see some big insider buys. While we wait, check out this free list of growing companies with considerable, recent, insider buying.
If you spot an error that warrants correction, please contact the editor at editorial-team@simplywallst.com. This article by Simply Wall St is general in nature. It does not constitute a recommendation to buy or sell any stock, and does not take account of your objectives, or your financial situation. Simply Wall St has no position in the stocks mentioned.
We aim to bring you long-term focused research analysis driven by fundamental data. Note that our analysis may not factor in the latest price-sensitive company announcements or qualitative material. Thank you for reading.
