
Wecon Holdings Limited (HKG:1793) Is Employing Capital Very Effectively

Today we are going to look at Wecon Holdings Limited (HKG:1793) to see whether it might be an attractive investment prospect. Specifically, we're going to calculate its Return On Capital Employed (ROCE), in the hopes of getting some insight into the business.
First, we'll go over how we calculate ROCE. Then we'll compare its ROCE to similar companies. And finally, we'll look at how its current liabilities are impacting its ROCE.
Return On Capital Employed (ROCE): What is it?
ROCE is a measure of a company's yearly pre-tax profit (its return), relative to the capital employed in the business. In general, businesses with a higher ROCE are usually better quality. Overall, it is a valuable metric that has its flaws. Author Edwin Whiting says to be careful when comparing the ROCE of different businesses, since 'No two businesses are exactly alike.
So, How Do We Calculate ROCE?
The formula for calculating the return on capital employed is:
Return on Capital Employed = Earnings Before Interest and Tax (EBIT) ÷ (Total Assets - Current Liabilities)
Or for Wecon Holdings:
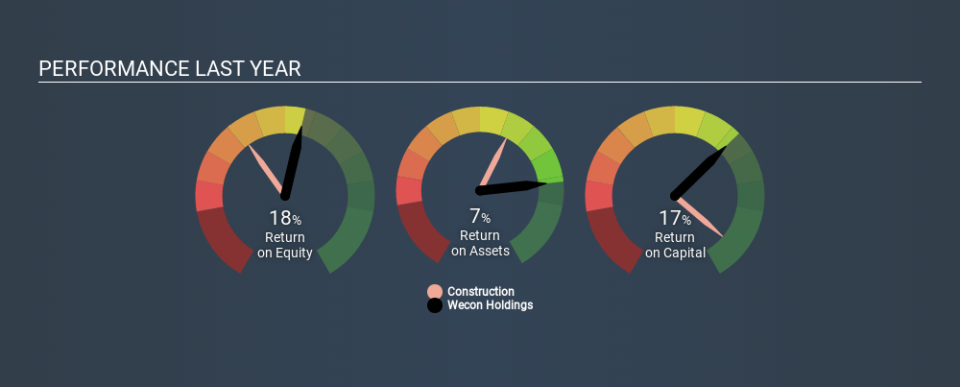
0.17 = HK$44m ÷ (HK$567m - HK$316m) (Based on the trailing twelve months to September 2019.)
Therefore, Wecon Holdings has an ROCE of 17%.
View our latest analysis for Wecon Holdings
Is Wecon Holdings's ROCE Good?
One way to assess ROCE is to compare similar companies. Wecon Holdings's ROCE appears to be substantially greater than the 12% average in the Construction industry. We consider this a positive sign, because it suggests it uses capital more efficiently than similar companies. Regardless of where Wecon Holdings sits next to its industry, its ROCE in absolute terms appears satisfactory, and this company could be worth a closer look.
Wecon Holdings's current ROCE of 17% is lower than its ROCE in the past, which was 28%, 3 years ago. So investors might consider if it has had issues recently. You can see in the image below how Wecon Holdings's ROCE compares to its industry. Click to see more on past growth.
When considering this metric, keep in mind that it is backwards looking, and not necessarily predictive. ROCE can be deceptive for cyclical businesses, as returns can look incredible in boom times, and terribly low in downturns. ROCE is only a point-in-time measure. If Wecon Holdings is cyclical, it could make sense to check out this free graph of past earnings, revenue and cash flow.
How Wecon Holdings's Current Liabilities Impact Its ROCE
Current liabilities are short term bills and invoices that need to be paid in 12 months or less. Due to the way the ROCE equation works, having large bills due in the near term can make it look as though a company has less capital employed, and thus a higher ROCE than usual. To counter this, investors can check if a company has high current liabilities relative to total assets.
Wecon Holdings has total assets of HK$567m and current liabilities of HK$316m. Therefore its current liabilities are equivalent to approximately 56% of its total assets. Wecon Holdings has a relatively high level of current liabilities, boosting its ROCE meaningfully.
The Bottom Line On Wecon Holdings's ROCE
While its ROCE looks decent, it wouldn't look so good if it reduced current liabilities. There might be better investments than Wecon Holdings out there, but you will have to work hard to find them . These promising businesses with rapidly growing earnings might be right up your alley.
For those who like to find winning investments this free list of growing companies with recent insider purchasing, could be just the ticket.
If you spot an error that warrants correction, please contact the editor at editorial-team@simplywallst.com. This article by Simply Wall St is general in nature. It does not constitute a recommendation to buy or sell any stock, and does not take account of your objectives, or your financial situation. Simply Wall St has no position in the stocks mentioned.
We aim to bring you long-term focused research analysis driven by fundamental data. Note that our analysis may not factor in the latest price-sensitive company announcements or qualitative material. Thank you for reading.

