
Why Andrews Sykes Group plc’s (LON:ASY) Return On Capital Employed Is Impressive

Today we'll look at Andrews Sykes Group plc (LON:ASY) and reflect on its potential as an investment. In particular, we'll consider its Return On Capital Employed (ROCE), as that can give us insight into how profitably the company is able to employ capital in its business.
First of all, we'll work out how to calculate ROCE. Next, we'll compare it to others in its industry. Then we'll determine how its current liabilities are affecting its ROCE.
Understanding Return On Capital Employed (ROCE)
ROCE measures the 'return' (pre-tax profit) a company generates from capital employed in its business. Generally speaking a higher ROCE is better. Ultimately, it is a useful but imperfect metric. Author Edwin Whiting says to be careful when comparing the ROCE of different businesses, since 'No two businesses are exactly alike.
How Do You Calculate Return On Capital Employed?
Analysts use this formula to calculate return on capital employed:
Return on Capital Employed = Earnings Before Interest and Tax (EBIT) ÷ (Total Assets - Current Liabilities)
Or for Andrews Sykes Group:
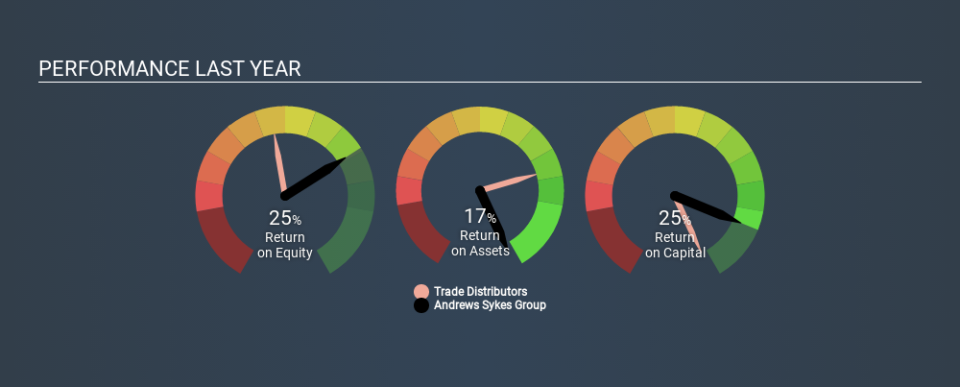
0.25 = UK£18m ÷ (UK£87m - UK£15m) (Based on the trailing twelve months to June 2019.)
Therefore, Andrews Sykes Group has an ROCE of 25%.
View our latest analysis for Andrews Sykes Group
Does Andrews Sykes Group Have A Good ROCE?
When making comparisons between similar businesses, investors may find ROCE useful. Andrews Sykes Group's ROCE appears to be substantially greater than the 13% average in the Trade Distributors industry. We consider this a positive sign, because it suggests it uses capital more efficiently than similar companies. Setting aside the comparison to its industry for a moment, Andrews Sykes Group's ROCE in absolute terms currently looks quite high.
You can click on the image below to see (in greater detail) how Andrews Sykes Group's past growth compares to other companies.
It is important to remember that ROCE shows past performance, and is not necessarily predictive. Companies in cyclical industries can be difficult to understand using ROCE, as returns typically look high during boom times, and low during busts. ROCE is only a point-in-time measure. How cyclical is Andrews Sykes Group? You can see for yourself by looking at this free graph of past earnings, revenue and cash flow.
What Are Current Liabilities, And How Do They Affect Andrews Sykes Group's ROCE?
Liabilities, such as supplier bills and bank overdrafts, are referred to as current liabilities if they need to be paid within 12 months. Due to the way ROCE is calculated, a high level of current liabilities makes a company look as though it has less capital employed, and thus can (sometimes unfairly) boost the ROCE. To counter this, investors can check if a company has high current liabilities relative to total assets.
Andrews Sykes Group has total liabilities of UK£15m and total assets of UK£87m. Therefore its current liabilities are equivalent to approximately 17% of its total assets. This is quite a low level of current liabilities which would not greatly boost the already high ROCE.
Our Take On Andrews Sykes Group's ROCE
, There might be better investments than Andrews Sykes Group out there, but you will have to work hard to find them . These promising businesses with rapidly growing earnings might be right up your alley.
If you like to buy stocks alongside management, then you might just love this free list of companies. (Hint: insiders have been buying them).
If you spot an error that warrants correction, please contact the editor at editorial-team@simplywallst.com. This article by Simply Wall St is general in nature. It does not constitute a recommendation to buy or sell any stock, and does not take account of your objectives, or your financial situation. Simply Wall St has no position in the stocks mentioned.
We aim to bring you long-term focused research analysis driven by fundamental data. Note that our analysis may not factor in the latest price-sensitive company announcements or qualitative material. Thank you for reading.

