
Why We Like Champion Iron Limited’s (ASX:CIA) 57% Return On Capital Employed

Today we are going to look at Champion Iron Limited (ASX:CIA) to see whether it might be an attractive investment prospect. Specifically, we'll consider its Return On Capital Employed (ROCE), since that will give us an insight into how efficiently the business can generate profits from the capital it requires.
First, we'll go over how we calculate ROCE. Then we'll compare its ROCE to similar companies. Last but not least, we'll look at what impact its current liabilities have on its ROCE.
Return On Capital Employed (ROCE): What is it?
ROCE is a measure of a company's yearly pre-tax profit (its return), relative to the capital employed in the business. All else being equal, a better business will have a higher ROCE. Overall, it is a valuable metric that has its flaws. Renowned investment researcher Michael Mauboussin has suggested that a high ROCE can indicate that 'one dollar invested in the company generates value of more than one dollar'.
How Do You Calculate Return On Capital Employed?
Analysts use this formula to calculate return on capital employed:
Return on Capital Employed = Earnings Before Interest and Tax (EBIT) ÷ (Total Assets - Current Liabilities)
Or for Champion Iron:
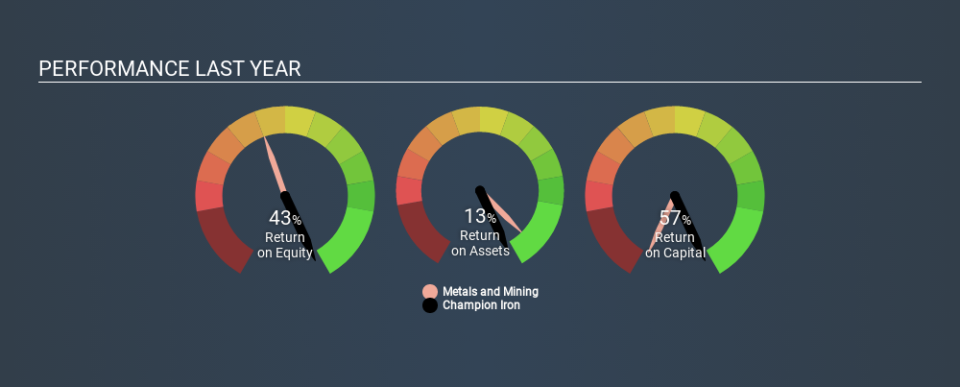
0.57 = CA$366m ÷ (CA$773m - CA$130m) (Based on the trailing twelve months to September 2019.)
So, Champion Iron has an ROCE of 57%.
View our latest analysis for Champion Iron
Does Champion Iron Have A Good ROCE?
ROCE is commonly used for comparing the performance of similar businesses. Using our data, we find that Champion Iron's ROCE is meaningfully better than the 8.0% average in the Metals and Mining industry. We would consider this a positive, as it suggests it is using capital more effectively than other similar companies. Setting aside the comparison to its industry for a moment, Champion Iron's ROCE in absolute terms currently looks quite high.
Champion Iron delivered an ROCE of 57%, which is better than 3 years ago, as was making losses back then. This makes us wonder if the company is improving. The image below shows how Champion Iron's ROCE compares to its industry, and you can click it to see more detail on its past growth.
It is important to remember that ROCE shows past performance, and is not necessarily predictive. Companies in cyclical industries can be difficult to understand using ROCE, as returns typically look high during boom times, and low during busts. ROCE is only a point-in-time measure. Given the industry it operates in, Champion Iron could be considered cyclical. Future performance is what matters, and you can see analyst predictions in our free report on analyst forecasts for the company.
Do Champion Iron's Current Liabilities Skew Its ROCE?
Short term (or current) liabilities, are things like supplier invoices, overdrafts, or tax bills that need to be paid within 12 months. The ROCE equation subtracts current liabilities from capital employed, so a company with a lot of current liabilities appears to have less capital employed, and a higher ROCE than otherwise. To counter this, investors can check if a company has high current liabilities relative to total assets.
Champion Iron has total liabilities of CA$130m and total assets of CA$773m. As a result, its current liabilities are equal to approximately 17% of its total assets. A minimal amount of current liabilities limits the impact on ROCE.
What We Can Learn From Champion Iron's ROCE
With low current liabilities and a high ROCE, Champion Iron could be worthy of further investigation. There might be better investments than Champion Iron out there, but you will have to work hard to find them . These promising businesses with rapidly growing earnings might be right up your alley.
If you are like me, then you will not want to miss this free list of growing companies that insiders are buying.
If you spot an error that warrants correction, please contact the editor at editorial-team@simplywallst.com. This article by Simply Wall St is general in nature. It does not constitute a recommendation to buy or sell any stock, and does not take account of your objectives, or your financial situation. Simply Wall St has no position in the stocks mentioned.
We aim to bring you long-term focused research analysis driven by fundamental data. Note that our analysis may not factor in the latest price-sensitive company announcements or qualitative material. Thank you for reading.

