
Why China Zhongwang Holdings Limited’s (HKG:1333) Return On Capital Employed Looks Uninspiring

Today we'll evaluate China Zhongwang Holdings Limited (HKG:1333) to determine whether it could have potential as an investment idea. Specifically, we'll consider its Return On Capital Employed (ROCE), since that will give us an insight into how efficiently the business can generate profits from the capital it requires.
Firstly, we'll go over how we calculate ROCE. Second, we'll look at its ROCE compared to similar companies. Finally, we'll look at how its current liabilities affect its ROCE.
Understanding Return On Capital Employed (ROCE)
ROCE measures the amount of pre-tax profits a company can generate from the capital employed in its business. Generally speaking a higher ROCE is better. Overall, it is a valuable metric that has its flaws. Author Edwin Whiting says to be careful when comparing the ROCE of different businesses, since 'No two businesses are exactly alike.
So, How Do We Calculate ROCE?
Analysts use this formula to calculate return on capital employed:
Return on Capital Employed = Earnings Before Interest and Tax (EBIT) ÷ (Total Assets - Current Liabilities)
Or for China Zhongwang Holdings:
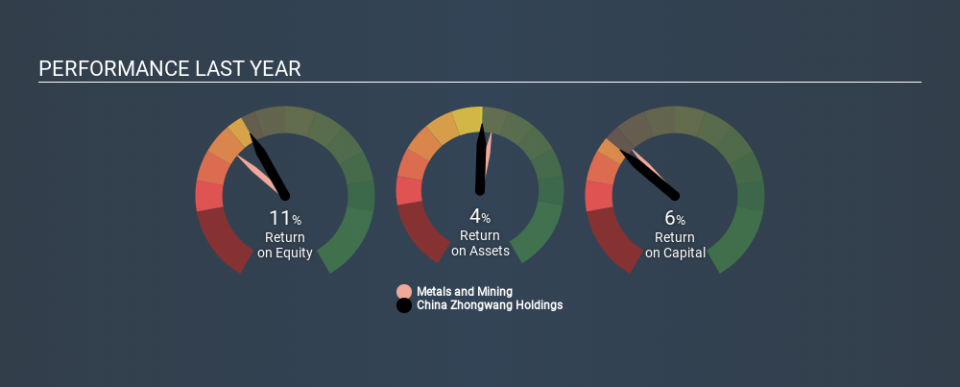
0.06 = CN¥4.9b ÷ (CN¥123b - CN¥41b) (Based on the trailing twelve months to September 2019.)
Therefore, China Zhongwang Holdings has an ROCE of 6.0%.
See our latest analysis for China Zhongwang Holdings
Is China Zhongwang Holdings's ROCE Good?
ROCE can be useful when making comparisons, such as between similar companies. Using our data, China Zhongwang Holdings's ROCE appears to be significantly below the 7.8% average in the Metals and Mining industry. This performance is not ideal, as it suggests the company may not be deploying its capital as effectively as some competitors. Separate from how China Zhongwang Holdings stacks up against its industry, its ROCE in absolute terms is mediocre; relative to the returns on government bonds. It is possible that there are more rewarding investments out there.
You can click on the image below to see (in greater detail) how China Zhongwang Holdings's past growth compares to other companies.
When considering this metric, keep in mind that it is backwards looking, and not necessarily predictive. ROCE can be misleading for companies in cyclical industries, with returns looking impressive during the boom times, but very weak during the busts. ROCE is, after all, simply a snap shot of a single year. Given the industry it operates in, China Zhongwang Holdings could be considered cyclical. Since the future is so important for investors, you should check out our free report on analyst forecasts for China Zhongwang Holdings.
What Are Current Liabilities, And How Do They Affect China Zhongwang Holdings's ROCE?
Liabilities, such as supplier bills and bank overdrafts, are referred to as current liabilities if they need to be paid within 12 months. Due to the way ROCE is calculated, a high level of current liabilities makes a company look as though it has less capital employed, and thus can (sometimes unfairly) boost the ROCE. To counter this, investors can check if a company has high current liabilities relative to total assets.
China Zhongwang Holdings has total assets of CN¥123b and current liabilities of CN¥41b. As a result, its current liabilities are equal to approximately 33% of its total assets. China Zhongwang Holdings's middling level of current liabilities have the effect of boosting its ROCE a bit.
Our Take On China Zhongwang Holdings's ROCE
Despite this, its ROCE is still mediocre, and you may find more appealing investments elsewhere. But note: make sure you look for a great company, not just the first idea you come across. So take a peek at this free list of interesting companies with strong recent earnings growth (and a P/E ratio below 20).
If you are like me, then you will not want to miss this free list of growing companies that insiders are buying.
If you spot an error that warrants correction, please contact the editor at editorial-team@simplywallst.com. This article by Simply Wall St is general in nature. It does not constitute a recommendation to buy or sell any stock, and does not take account of your objectives, or your financial situation. Simply Wall St has no position in the stocks mentioned.
We aim to bring you long-term focused research analysis driven by fundamental data. Note that our analysis may not factor in the latest price-sensitive company announcements or qualitative material. Thank you for reading.

