
Why MERCK Kommanditgesellschaft auf Aktien's (ETR:MRK) High P/E Ratio Isn't Necessarily A Bad Thing

Today, we'll introduce the concept of the P/E ratio for those who are learning about investing. We'll apply a basic P/E ratio analysis to MERCK Kommanditgesellschaft auf Aktien's (ETR:MRK), to help you decide if the stock is worth further research. MERCK Kommanditgesellschaft auf Aktien has a P/E ratio of 44.10, based on the last twelve months. That is equivalent to an earnings yield of about 2.3%.
View our latest analysis for MERCK Kommanditgesellschaft auf Aktien
How Do You Calculate MERCK Kommanditgesellschaft auf Aktien's P/E Ratio?
The formula for price to earnings is:
Price to Earnings Ratio = Share Price ÷ Earnings per Share (EPS)
Or for MERCK Kommanditgesellschaft auf Aktien:
P/E of 44.10 = EUR115.90 ÷ EUR2.63 (Based on the trailing twelve months to September 2019.)
Is A High Price-to-Earnings Ratio Good?
The higher the P/E ratio, the higher the price tag of a business, relative to its trailing earnings. That isn't necessarily good or bad, but a high P/E implies relatively high expectations of what a company can achieve in the future.
How Does MERCK Kommanditgesellschaft auf Aktien's P/E Ratio Compare To Its Peers?
The P/E ratio essentially measures market expectations of a company. As you can see below, MERCK Kommanditgesellschaft auf Aktien has a higher P/E than the average company (23.6) in the pharmaceuticals industry.
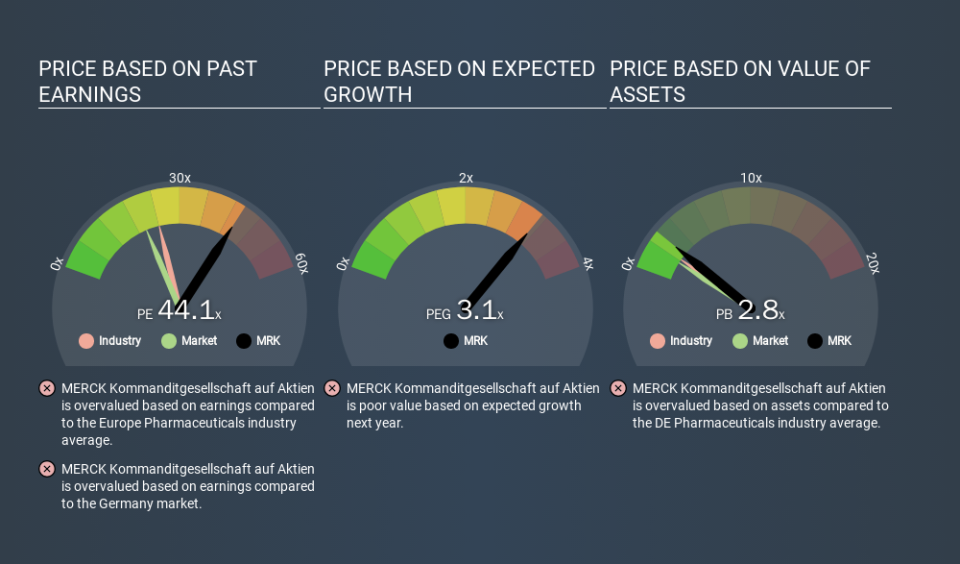
MERCK Kommanditgesellschaft auf Aktien's P/E tells us that market participants think the company will perform better than its industry peers, going forward. Shareholders are clearly optimistic, but the future is always uncertain. So further research is always essential. I often monitor director buying and selling.
How Growth Rates Impact P/E Ratios
If earnings fall then in the future the 'E' will be lower. Therefore, even if you pay a low multiple of earnings now, that multiple will become higher in the future. So while a stock may look cheap based on past earnings, it could be expensive based on future earnings.
MERCK Kommanditgesellschaft auf Aktien shrunk earnings per share by 40% over the last year. And EPS is down 8.3% a year, over the last 3 years. This might lead to low expectations.
Don't Forget: The P/E Does Not Account For Debt or Bank Deposits
The 'Price' in P/E reflects the market capitalization of the company. Thus, the metric does not reflect cash or debt held by the company. Theoretically, a business can improve its earnings (and produce a lower P/E in the future) by investing in growth. That means taking on debt (or spending its cash).
Such expenditure might be good or bad, in the long term, but the point here is that the balance sheet is not reflected by this ratio.
How Does MERCK Kommanditgesellschaft auf Aktien's Debt Impact Its P/E Ratio?
MERCK Kommanditgesellschaft auf Aktien's net debt is 13% of its market cap. That's enough debt to impact the P/E ratio a little; so keep it in mind if you're comparing it to companies without debt.
The Verdict On MERCK Kommanditgesellschaft auf Aktien's P/E Ratio
MERCK Kommanditgesellschaft auf Aktien's P/E is 44.1 which is above average (20.0) in its market. With a bit of debt, but a lack of recent growth, it's safe to say the market is expecting improved profit performance from the company, in the next few years.
Investors have an opportunity when market expectations about a stock are wrong. People often underestimate remarkable growth -- so investors can make money when fast growth is not fully appreciated. So this free visual report on analyst forecasts could hold the key to an excellent investment decision.
Of course you might be able to find a better stock than MERCK Kommanditgesellschaft auf Aktien. So you may wish to see this free collection of other companies that have grown earnings strongly.
If you spot an error that warrants correction, please contact the editor at editorial-team@simplywallst.com. This article by Simply Wall St is general in nature. It does not constitute a recommendation to buy or sell any stock, and does not take account of your objectives, or your financial situation. Simply Wall St has no position in the stocks mentioned.
We aim to bring you long-term focused research analysis driven by fundamental data. Note that our analysis may not factor in the latest price-sensitive company announcements or qualitative material. Thank you for reading.
