
Why MS INTERNATIONAL plc’s (LON:MSI) Use Of Investor Capital Doesn’t Look Great

Today we'll evaluate MS INTERNATIONAL plc (LON:MSI) to determine whether it could have potential as an investment idea. Specifically, we're going to calculate its Return On Capital Employed (ROCE), in the hopes of getting some insight into the business.
Firstly, we'll go over how we calculate ROCE. Next, we'll compare it to others in its industry. Then we'll determine how its current liabilities are affecting its ROCE.
Understanding Return On Capital Employed (ROCE)
ROCE is a metric for evaluating how much pre-tax income (in percentage terms) a company earns on the capital invested in its business. In general, businesses with a higher ROCE are usually better quality. Ultimately, it is a useful but imperfect metric. Author Edwin Whiting says to be careful when comparing the ROCE of different businesses, since 'No two businesses are exactly alike.
So, How Do We Calculate ROCE?
Analysts use this formula to calculate return on capital employed:
Return on Capital Employed = Earnings Before Interest and Tax (EBIT) ÷ (Total Assets - Current Liabilities)
Or for MS INTERNATIONAL:
0.056 = UK£2.4m ÷ (UK£72m - UK£29m) (Based on the trailing twelve months to October 2019.)
So, MS INTERNATIONAL has an ROCE of 5.6%.
Check out our latest analysis for MS INTERNATIONAL
Is MS INTERNATIONAL's ROCE Good?
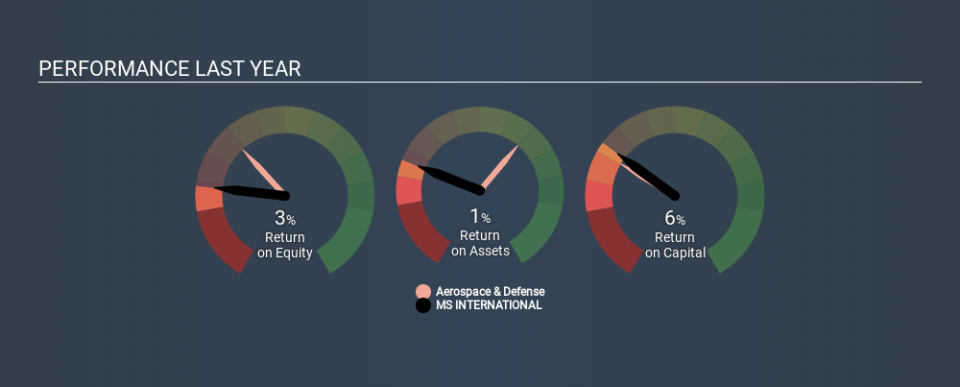
When making comparisons between similar businesses, investors may find ROCE useful. In this analysis, MS INTERNATIONAL's ROCE appears meaningfully below the 9.3% average reported by the Aerospace & Defense industry. This performance could be negative if sustained, as it suggests the business may underperform its industry. Separate from how MS INTERNATIONAL stacks up against its industry, its ROCE in absolute terms is mediocre; relative to the returns on government bonds. Investors may wish to consider higher-performing investments.
You can see in the image below how MS INTERNATIONAL's ROCE compares to its industry. Click to see more on past growth.
Remember that this metric is backwards looking - it shows what has happened in the past, and does not accurately predict the future. Companies in cyclical industries can be difficult to understand using ROCE, as returns typically look high during boom times, and low during busts. ROCE is, after all, simply a snap shot of a single year. If MS INTERNATIONAL is cyclical, it could make sense to check out this free graph of past earnings, revenue and cash flow.
How MS INTERNATIONAL's Current Liabilities Impact Its ROCE
Current liabilities are short term bills and invoices that need to be paid in 12 months or less. Due to the way the ROCE equation works, having large bills due in the near term can make it look as though a company has less capital employed, and thus a higher ROCE than usual. To counteract this, we check if a company has high current liabilities, relative to its total assets.
MS INTERNATIONAL has total assets of UK£72m and current liabilities of UK£29m. As a result, its current liabilities are equal to approximately 40% of its total assets. MS INTERNATIONAL's middling level of current liabilities have the effect of boosting its ROCE a bit.
The Bottom Line On MS INTERNATIONAL's ROCE
With this level of liabilities and a mediocre ROCE, there are potentially better investments out there. But note: make sure you look for a great company, not just the first idea you come across. So take a peek at this free list of interesting companies with strong recent earnings growth (and a P/E ratio below 20).
I will like MS INTERNATIONAL better if I see some big insider buys. While we wait, check out this free list of growing companies with considerable, recent, insider buying.
If you spot an error that warrants correction, please contact the editor at editorial-team@simplywallst.com. This article by Simply Wall St is general in nature. It does not constitute a recommendation to buy or sell any stock, and does not take account of your objectives, or your financial situation. Simply Wall St has no position in the stocks mentioned.
We aim to bring you long-term focused research analysis driven by fundamental data. Note that our analysis may not factor in the latest price-sensitive company announcements or qualitative material. Thank you for reading.

