
Why Shun Ho Property Investments Limited’s (HKG:219) Use Of Investor Capital Doesn’t Look Great

Today we'll look at Shun Ho Property Investments Limited (HKG:219) and reflect on its potential as an investment. In particular, we'll consider its Return On Capital Employed (ROCE), as that can give us insight into how profitably the company is able to employ capital in its business.
First up, we'll look at what ROCE is and how we calculate it. Second, we'll look at its ROCE compared to similar companies. Last but not least, we'll look at what impact its current liabilities have on its ROCE.
What is Return On Capital Employed (ROCE)?
ROCE is a measure of a company's yearly pre-tax profit (its return), relative to the capital employed in the business. Generally speaking a higher ROCE is better. In brief, it is a useful tool, but it is not without drawbacks. Renowned investment researcher Michael Mauboussin has suggested that a high ROCE can indicate that 'one dollar invested in the company generates value of more than one dollar'.
How Do You Calculate Return On Capital Employed?
Analysts use this formula to calculate return on capital employed:
Return on Capital Employed = Earnings Before Interest and Tax (EBIT) ÷ (Total Assets - Current Liabilities)
Or for Shun Ho Property Investments:
0.035 = HK$323m ÷ (HK$9.6b - HK$317m) (Based on the trailing twelve months to June 2019.)
Therefore, Shun Ho Property Investments has an ROCE of 3.5%.
See our latest analysis for Shun Ho Property Investments
Is Shun Ho Property Investments's ROCE Good?
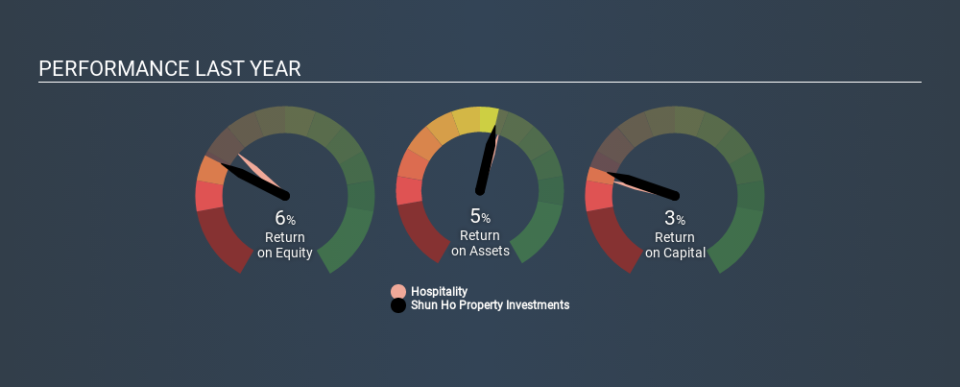
One way to assess ROCE is to compare similar companies. We can see Shun Ho Property Investments's ROCE is meaningfully below the Hospitality industry average of 5.4%. This performance could be negative if sustained, as it suggests the business may underperform its industry. Putting aside Shun Ho Property Investments's performance relative to its industry, its ROCE in absolute terms is poor - considering the risk of owning stocks compared to government bonds. Readers may wish to look for more rewarding investments.
We can see that, Shun Ho Property Investments currently has an ROCE of 3.5% compared to its ROCE 3 years ago, which was 2.8%. This makes us wonder if the company is improving. You can click on the image below to see (in greater detail) how Shun Ho Property Investments's past growth compares to other companies.
When considering this metric, keep in mind that it is backwards looking, and not necessarily predictive. ROCE can be deceptive for cyclical businesses, as returns can look incredible in boom times, and terribly low in downturns. ROCE is only a point-in-time measure. If Shun Ho Property Investments is cyclical, it could make sense to check out this free graph of past earnings, revenue and cash flow.
Do Shun Ho Property Investments's Current Liabilities Skew Its ROCE?
Short term (or current) liabilities, are things like supplier invoices, overdrafts, or tax bills that need to be paid within 12 months. Due to the way ROCE is calculated, a high level of current liabilities makes a company look as though it has less capital employed, and thus can (sometimes unfairly) boost the ROCE. To counteract this, we check if a company has high current liabilities, relative to its total assets.
Shun Ho Property Investments has total assets of HK$9.6b and current liabilities of HK$317m. Therefore its current liabilities are equivalent to approximately 3.3% of its total assets. Shun Ho Property Investments has a low level of current liabilities, which have a negligible impact on its already low ROCE.
What We Can Learn From Shun Ho Property Investments's ROCE
Nonetheless, there may be better places to invest your capital. But note: make sure you look for a great company, not just the first idea you come across. So take a peek at this free list of interesting companies with strong recent earnings growth (and a P/E ratio below 20).
If you are like me, then you will not want to miss this free list of growing companies that insiders are buying.
If you spot an error that warrants correction, please contact the editor at editorial-team@simplywallst.com. This article by Simply Wall St is general in nature. It does not constitute a recommendation to buy or sell any stock, and does not take account of your objectives, or your financial situation. Simply Wall St has no position in the stocks mentioned.
We aim to bring you long-term focused research analysis driven by fundamental data. Note that our analysis may not factor in the latest price-sensitive company announcements or qualitative material. Thank you for reading.

