
Are Wienerberger AG’s (VIE:WIE) High Returns Really That Great?

Today we are going to look at Wienerberger AG (VIE:WIE) to see whether it might be an attractive investment prospect. In particular, we'll consider its Return On Capital Employed (ROCE), as that can give us insight into how profitably the company is able to employ capital in its business.
Firstly, we'll go over how we calculate ROCE. Next, we'll compare it to others in its industry. Then we'll determine how its current liabilities are affecting its ROCE.
Understanding Return On Capital Employed (ROCE)
ROCE measures the 'return' (pre-tax profit) a company generates from capital employed in its business. In general, businesses with a higher ROCE are usually better quality. Overall, it is a valuable metric that has its flaws. Renowned investment researcher Michael Mauboussin has suggested that a high ROCE can indicate that 'one dollar invested in the company generates value of more than one dollar'.
How Do You Calculate Return On Capital Employed?
Analysts use this formula to calculate return on capital employed:
Return on Capital Employed = Earnings Before Interest and Tax (EBIT) ÷ (Total Assets - Current Liabilities)
Or for Wienerberger:
0.12 = €363m ÷ (€4.1b - €1.2b) (Based on the trailing twelve months to December 2019.)
Therefore, Wienerberger has an ROCE of 12%.
View our latest analysis for Wienerberger
Does Wienerberger Have A Good ROCE?
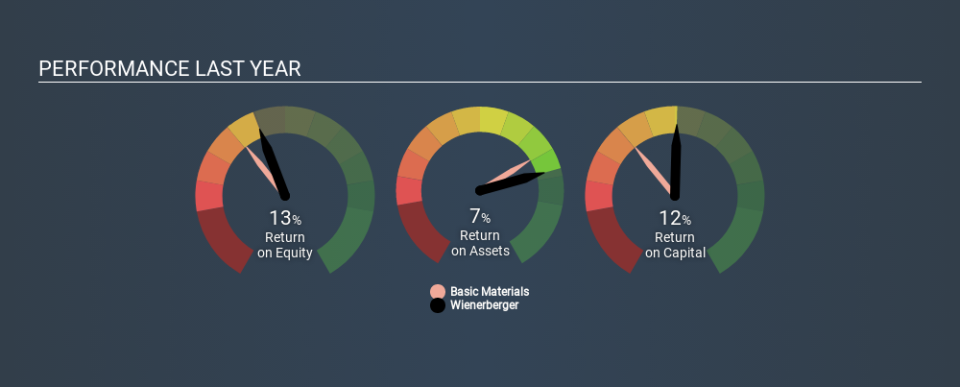
One way to assess ROCE is to compare similar companies. In our analysis, Wienerberger's ROCE is meaningfully higher than the 9.4% average in the Basic Materials industry. We consider this a positive sign, because it suggests it uses capital more efficiently than similar companies. Separate from Wienerberger's performance relative to its industry, its ROCE in absolute terms looks satisfactory, and it may be worth researching in more depth.
In our analysis, Wienerberger's ROCE appears to be 12%, compared to 3 years ago, when its ROCE was 7.3%. This makes us think about whether the company has been reinvesting shrewdly. You can click on the image below to see (in greater detail) how Wienerberger's past growth compares to other companies.
When considering this metric, keep in mind that it is backwards looking, and not necessarily predictive. Companies in cyclical industries can be difficult to understand using ROCE, as returns typically look high during boom times, and low during busts. ROCE is only a point-in-time measure. Since the future is so important for investors, you should check out our free report on analyst forecasts for Wienerberger.
Do Wienerberger's Current Liabilities Skew Its ROCE?
Current liabilities are short term bills and invoices that need to be paid in 12 months or less. Due to the way the ROCE equation works, having large bills due in the near term can make it look as though a company has less capital employed, and thus a higher ROCE than usual. To check the impact of this, we calculate if a company has high current liabilities relative to its total assets.
Wienerberger has total assets of €4.1b and current liabilities of €1.2b. As a result, its current liabilities are equal to approximately 28% of its total assets. A fairly low level of current liabilities is not influencing the ROCE too much.
What We Can Learn From Wienerberger's ROCE
Overall, Wienerberger has a decent ROCE and could be worthy of further research. There might be better investments than Wienerberger out there, but you will have to work hard to find them . These promising businesses with rapidly growing earnings might be right up your alley.
If you are like me, then you will not want to miss this free list of growing companies that insiders are buying.
If you spot an error that warrants correction, please contact the editor at editorial-team@simplywallst.com. This article by Simply Wall St is general in nature. It does not constitute a recommendation to buy or sell any stock, and does not take account of your objectives, or your financial situation. Simply Wall St has no position in the stocks mentioned.
We aim to bring you long-term focused research analysis driven by fundamental data. Note that our analysis may not factor in the latest price-sensitive company announcements or qualitative material. Thank you for reading.

