
Here's How P/E Ratios Can Help Us Understand Sinarmas Land Limited (SGX:A26)

This article is for investors who would like to improve their understanding of price to earnings ratios (P/E ratios). To keep it practical, we'll show how Sinarmas Land Limited's (SGX:A26) P/E ratio could help you assess the value on offer. Looking at earnings over the last twelve months, Sinarmas Land has a P/E ratio of 2.58. That is equivalent to an earnings yield of about 38.7%.
View our latest analysis for Sinarmas Land
How Do I Calculate A Price To Earnings Ratio?
The formula for P/E is:
Price to Earnings Ratio = Price per Share ÷ Earnings per Share (EPS)
Or for Sinarmas Land:
P/E of 2.58 = SGD0.24 ÷ SGD0.09 (Based on the year to September 2019.)
Is A High Price-to-Earnings Ratio Good?
A higher P/E ratio implies that investors pay a higher price for the earning power of the business. All else being equal, it's better to pay a low price -- but as Warren Buffett said, 'It's far better to buy a wonderful company at a fair price than a fair company at a wonderful price'.
How Does Sinarmas Land's P/E Ratio Compare To Its Peers?
We can get an indication of market expectations by looking at the P/E ratio. If you look at the image below, you can see Sinarmas Land has a lower P/E than the average (10.9) in the real estate industry classification.
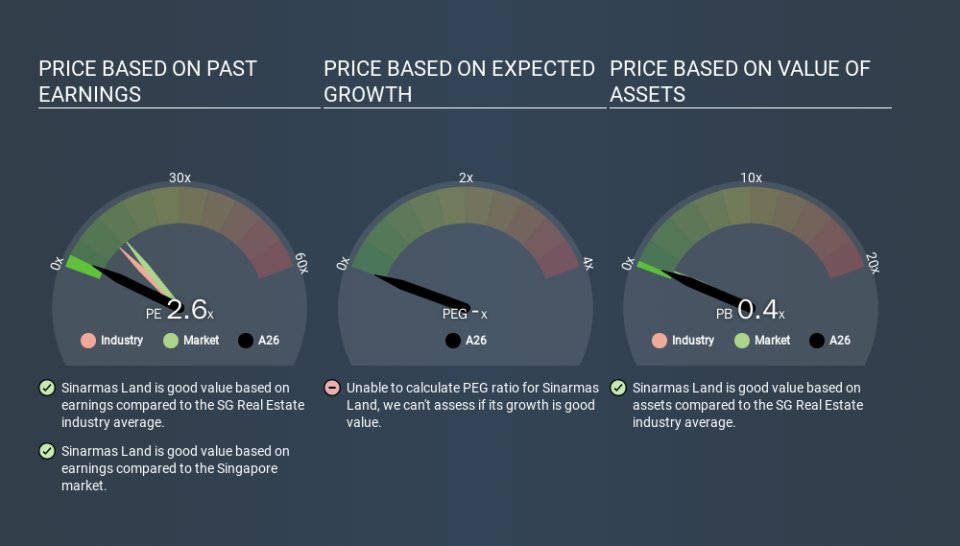
Sinarmas Land's P/E tells us that market participants think it will not fare as well as its peers in the same industry. While current expectations are low, the stock could be undervalued if the situation is better than the market assumes. If you consider the stock interesting, further research is recommended. For example, I often monitor director buying and selling.
How Growth Rates Impact P/E Ratios
P/E ratios primarily reflect market expectations around earnings growth rates. When earnings grow, the 'E' increases, over time. That means unless the share price increases, the P/E will reduce in a few years. Then, a lower P/E should attract more buyers, pushing the share price up.
Notably, Sinarmas Land grew EPS by a whopping 37% in the last year. And its annual EPS growth rate over 5 years is 7.8%. I'd therefore be a little surprised if its P/E ratio was not relatively high.
Remember: P/E Ratios Don't Consider The Balance Sheet
The 'Price' in P/E reflects the market capitalization of the company. In other words, it does not consider any debt or cash that the company may have on the balance sheet. In theory, a company can lower its future P/E ratio by using cash or debt to invest in growth.
While growth expenditure doesn't always pay off, the point is that it is a good option to have; but one that the P/E ratio ignores.
So What Does Sinarmas Land's Balance Sheet Tell Us?
Sinarmas Land's net debt is 76% of its market cap. This is enough debt that you'd have to make some adjustments before using the P/E ratio to compare it to a company with net cash.
The Bottom Line On Sinarmas Land's P/E Ratio
Sinarmas Land trades on a P/E ratio of 2.6, which is below the SG market average of 13.4. While the EPS growth last year was strong, the significant debt levels reduce the number of options available to management. The low P/E ratio suggests current market expectations are muted, implying these levels of growth will not continue.
Investors should be looking to buy stocks that the market is wrong about. As value investor Benjamin Graham famously said, 'In the short run, the market is a voting machine but in the long run, it is a weighing machine. We don't have analyst forecasts, but shareholders might want to examine this detailed historical graph of earnings, revenue and cash flow.
You might be able to find a better buy than Sinarmas Land. If you want a selection of possible winners, check out this free list of interesting companies that trade on a P/E below 20 (but have proven they can grow earnings).
If you spot an error that warrants correction, please contact the editor at editorial-team@simplywallst.com. This article by Simply Wall St is general in nature. It does not constitute a recommendation to buy or sell any stock, and does not take account of your objectives, or your financial situation. Simply Wall St has no position in the stocks mentioned.
We aim to bring you long-term focused research analysis driven by fundamental data. Note that our analysis may not factor in the latest price-sensitive company announcements or qualitative material. Thank you for reading.

