
Do You Know What National Western Life Group, Inc.'s (NASDAQ:NWLI) P/E Ratio Means?

This article is written for those who want to get better at using price to earnings ratios (P/E ratios). To keep it practical, we'll show how National Western Life Group, Inc.'s (NASDAQ:NWLI) P/E ratio could help you assess the value on offer. What is National Western Life Group's P/E ratio? Well, based on the last twelve months it is 8.95. That corresponds to an earnings yield of approximately 11.2%.
View our latest analysis for National Western Life Group
How Do I Calculate A Price To Earnings Ratio?
The formula for price to earnings is:
Price to Earnings Ratio = Price per Share ÷ Earnings per Share (EPS)
Or for National Western Life Group:
P/E of 8.95 = USD284.60 ÷ USD31.81 (Based on the year to September 2019.)
Is A High P/E Ratio Good?
A higher P/E ratio implies that investors pay a higher price for the earning power of the business. All else being equal, it's better to pay a low price -- but as Warren Buffett said, 'It's far better to buy a wonderful company at a fair price than a fair company at a wonderful price'.
Does National Western Life Group Have A Relatively High Or Low P/E For Its Industry?
The P/E ratio essentially measures market expectations of a company. If you look at the image below, you can see National Western Life Group has a lower P/E than the average (16.9) in the insurance industry classification.
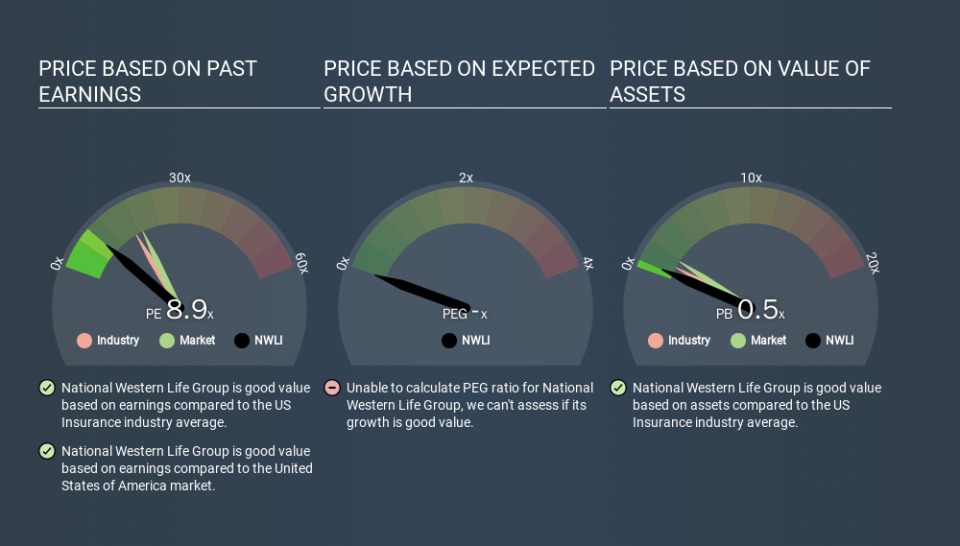
Its relatively low P/E ratio indicates that National Western Life Group shareholders think it will struggle to do as well as other companies in its industry classification. While current expectations are low, the stock could be undervalued if the situation is better than the market assumes. If you consider the stock interesting, further research is recommended. For example, I often monitor director buying and selling.
How Growth Rates Impact P/E Ratios
P/E ratios primarily reflect market expectations around earnings growth rates. If earnings are growing quickly, then the 'E' in the equation will increase faster than it would otherwise. Therefore, even if you pay a high multiple of earnings now, that multiple will become lower in the future. So while a stock may look expensive based on past earnings, it could be cheap based on future earnings.
National Western Life Group shrunk earnings per share by 14% over the last year. But it has grown its earnings per share by 1.9% per year over the last five years.
Remember: P/E Ratios Don't Consider The Balance Sheet
It's important to note that the P/E ratio considers the market capitalization, not the enterprise value. In other words, it does not consider any debt or cash that the company may have on the balance sheet. In theory, a company can lower its future P/E ratio by using cash or debt to invest in growth.
Spending on growth might be good or bad a few years later, but the point is that the P/E ratio does not account for the option (or lack thereof).
How Does National Western Life Group's Debt Impact Its P/E Ratio?
National Western Life Group has net cash of US$172m. This is fairly high at 17% of its market capitalization. That might mean balance sheet strength is important to the business, but should also help push the P/E a bit higher than it would otherwise be.
The Verdict On National Western Life Group's P/E Ratio
National Western Life Group's P/E is 8.9 which is below average (19.0) in the US market. The recent drop in earnings per share would almost certainly temper expectations, the relatively strong balance sheet will allow the company time to invest in growth. If it achieves that, then there's real potential that the low P/E could eventually indicate undervaluation.
When the market is wrong about a stock, it gives savvy investors an opportunity. If it is underestimating a company, investors can make money by buying and holding the shares until the market corrects itself. Although we don't have analyst forecasts you might want to assess this data-rich visualization of earnings, revenue and cash flow.
But note: National Western Life Group may not be the best stock to buy. So take a peek at this free list of interesting companies with strong recent earnings growth (and a P/E ratio below 20).
If you spot an error that warrants correction, please contact the editor at editorial-team@simplywallst.com. This article by Simply Wall St is general in nature. It does not constitute a recommendation to buy or sell any stock, and does not take account of your objectives, or your financial situation. Simply Wall St has no position in the stocks mentioned.
We aim to bring you long-term focused research analysis driven by fundamental data. Note that our analysis may not factor in the latest price-sensitive company announcements or qualitative material. Thank you for reading.

