
Do You Know What Riverview Financial Corporation's (NASDAQ:RIVE) P/E Ratio Means?

Riverview Financial (NASDAQ:RIVE) shares have given back plenty of recent gains in the last month, dropping . Looking back further, the stock is up 9.2% in the last year.
All else being equal, a sharp share price increase should make a stock less attractive to potential investors. While the market sentiment towards a stock is very changeable, in the long run, the share price will tend to move in the same direction as earnings per share. So some would prefer to hold off buying when there is a lot of optimism towards a stock. Perhaps the simplest way to get a read on investors' expectations of a business is to look at its Price to Earnings Ratio (PE Ratio). A high P/E implies that investors have high expectations of what a company can achieve compared to a company with a low P/E ratio.
View our latest analysis for Riverview Financial
Does Riverview Financial Have A Relatively High Or Low P/E For Its Industry?
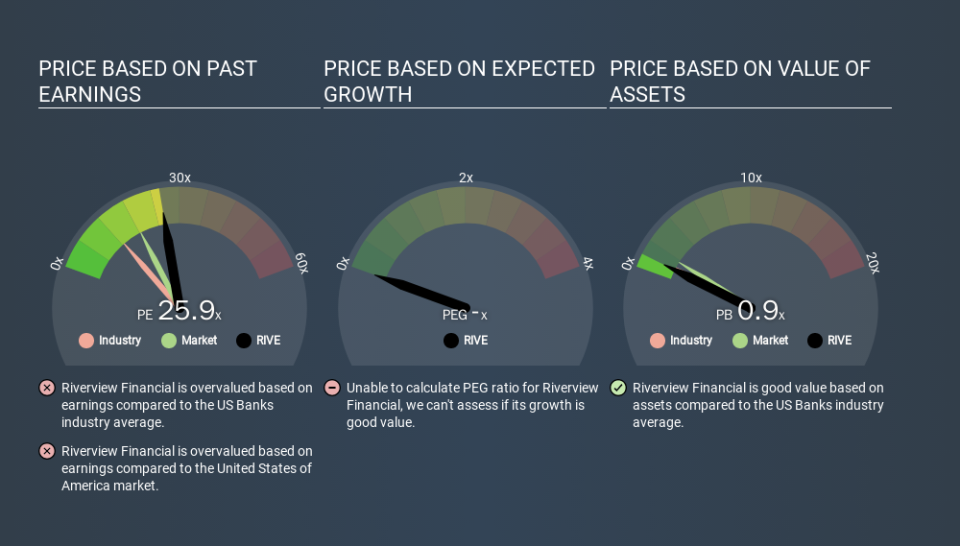
Riverview Financial's P/E of 25.86 indicates some degree of optimism towards the stock. The image below shows that Riverview Financial has a higher P/E than the average (12.6) P/E for companies in the banks industry.
Its relatively high P/E ratio indicates that Riverview Financial shareholders think it will perform better than other companies in its industry classification. The market is optimistic about the future, but that doesn't guarantee future growth. So investors should delve deeper. I like to check if company insiders have been buying or selling.
How Growth Rates Impact P/E Ratios
If earnings fall then in the future the 'E' will be lower. That means even if the current P/E is low, it will increase over time if the share price stays flat. So while a stock may look cheap based on past earnings, it could be expensive based on future earnings.
Riverview Financial shrunk earnings per share by 61% over the last year. And EPS is down 14% a year, over the last 5 years. This growth rate might warrant a below average P/E ratio.
Remember: P/E Ratios Don't Consider The Balance Sheet
One drawback of using a P/E ratio is that it considers market capitalization, but not the balance sheet. In other words, it does not consider any debt or cash that the company may have on the balance sheet. The exact same company would hypothetically deserve a higher P/E ratio if it had a strong balance sheet, than if it had a weak one with lots of debt, because a cashed up company can spend on growth.
Such expenditure might be good or bad, in the long term, but the point here is that the balance sheet is not reflected by this ratio.
Is Debt Impacting Riverview Financial's P/E?
With net cash of US$48m, Riverview Financial has a very strong balance sheet, which may be important for its business. Having said that, at 43% of its market capitalization the cash hoard would contribute towards a higher P/E ratio.
The Verdict On Riverview Financial's P/E Ratio
Riverview Financial has a P/E of 25.9. That's higher than the average in its market, which is 18.5. The recent drop in earnings per share would make some investors cautious, but the healthy balance sheet means the company retains potential for future growth. If fails to eventuate, the current high P/E could prove to be temporary, as the share price falls. What can be absolutely certain is that the market has become less optimistic about Riverview Financial over the last month, with the P/E ratio falling from 25.9 back then to 25.9 today. For those who don't like to trade against momentum, that could be a warning sign, but a contrarian investor might want to take a closer look.
When the market is wrong about a stock, it gives savvy investors an opportunity. As value investor Benjamin Graham famously said, 'In the short run, the market is a voting machine but in the long run, it is a weighing machine. Although we don't have analyst forecasts you could get a better understanding of its growth by checking out this more detailed historical graph of earnings, revenue and cash flow.
Of course, you might find a fantastic investment by looking at a few good candidates. So take a peek at this free list of companies with modest (or no) debt, trading on a P/E below 20.
If you spot an error that warrants correction, please contact the editor at editorial-team@simplywallst.com. This article by Simply Wall St is general in nature. It does not constitute a recommendation to buy or sell any stock, and does not take account of your objectives, or your financial situation. Simply Wall St has no position in the stocks mentioned.
We aim to bring you long-term focused research analysis driven by fundamental data. Note that our analysis may not factor in the latest price-sensitive company announcements or qualitative material. Thank you for reading.
