
Is May always this cold on P.E.I.? New climate dashboard has the answers

CBC News has launched a new climate dashboard to help Canadians look at today's weather and how it connects to climate change.
In addition to the forecast, the climate dashboard makes it easy to compare the current weather to what it's been like in the past.
Here's how it all works.
Focusing on Charlottetown
To start, find the dashboard here.
The first time you open the dashboard, it should prompt you to select your location. Search for Charlottetown and select it.
If you're not prompted, you can change the default Toronto location by clicking on the home icon next to the city name and then searching for Charlottetown. You can change your home city at any time in this way.
Using the search box on the right, you can look at other cities and add them to your favourites.
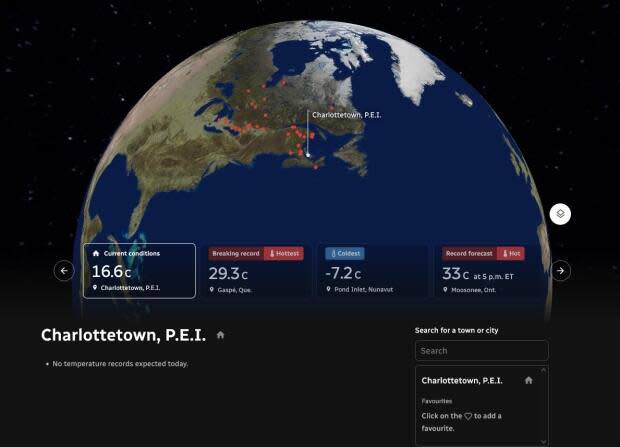
There is also a scroll bar showing where temperature records are forecast to be broken on the current day. You can move the globe to those locations by hovering over the red or blue dots, or clicking on the scroll bar.
You can also change the view of the globe. The screenshot above shows the topography view. You can also look at the cloud cover or a heat map showing temperatures across the country.
Compare the forecast
Just below the globe, you'll find the forecast.
In addition to the forecast fed from Environment Canada, the dashboard includes how much the temperature varies from what's normal for that day. Currently, the normal is measured over the years from 1981-2010.
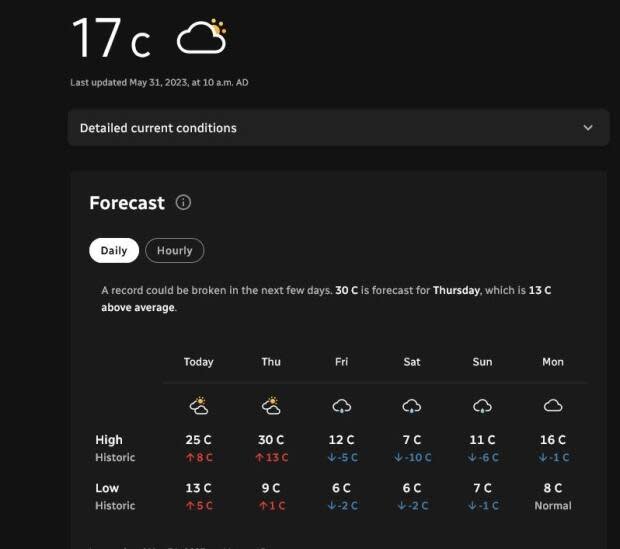
You'll notice most days in the next week have highs that vary a lot from normal, all but one by 5 C. This, in itself, is actually normal, explains CBC meteorologist Jay Scotland.
"A normal daytime high in spring is something we expect, but don't always get. It often depends which way the wind is blowing," said Scotland.
"A sunny day with a warm southerly wind may see the temperature soar well above average, much like today. Ocean water takes a lot longer to warm up than land though, which can really subdue temperatures when we have a strong enough wind from the north."
Combined, those hotter days and colder days result in an average that may itself not often be seen.
Cold and hot days
The next section shows how common it is historically for the temperature to remain below freezing, or rise above 30 C.
You won't see many results from this for the spring and fall, but they're important for winter and summer.
Cold days in winter are important for pest control on the Island. Fewer cold days means more mosquitoes, earwigs, and rodents. Hot days in the summer can be dangerous for people working outside and residents who don't have air conditioning.
P.E.I. is seeing fewer cold days and more hot days.
Diving into history
The dashboard includes a powerful tool for comparing recent weather to previous years going back to the 1870s.
The tool allows you to select a look at the last 30 days, 90 days, or 365 days, at average minimum and maximum temperatures, and at the 24-hour average. Red lines indicate above-average temperatures, and blue lines below-average.
We can use the 30-day view to answer the question in the headline: Is May always this cold?
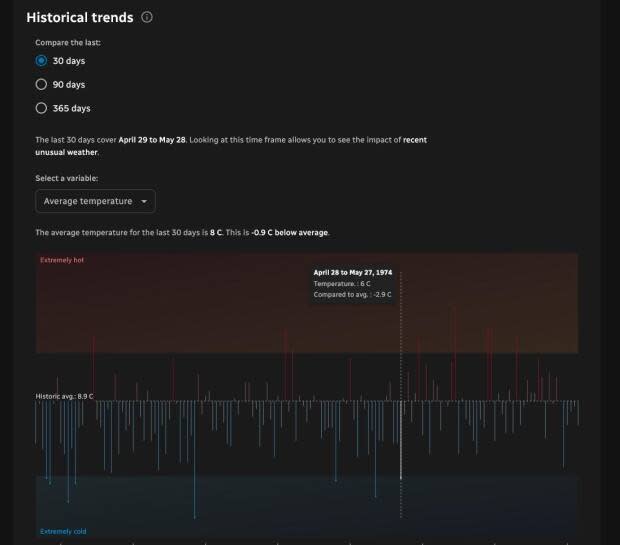
No, it's not. It has been colder than normal: 1.1 C colder from April 29 to May 28.
But colder Mays are becoming more rare. The last time those 30 days qualified as extremely cold (more than 2.8 C below normal) was in 1974. Since then, we have seen five extremely hot months.

