
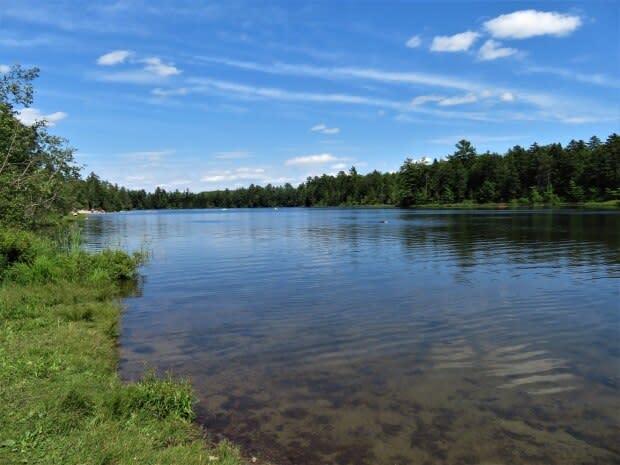
For what it covers, province's report on water quality finds rivers in good shape
The New Brunswick government has released its first report on the state of water quality in lakes and rivers.
"Overall it's looking pretty good," said Michelle Gray, an associate professor in the University of New Brunswick's faculty of forestry and environmental management.
The report compiles results of monitoring tests from 2003 to 2016, fulfilling one of the commitments in a 10-year water strategy released in late 2017.
In general, the report said, surface water quality in the province was good and better than it used to be.
"Over the last 30 years there have been significant improvements in surface water management programs," the report concluded, also crediting regulations and increased stewardship activities.
Lois Corbett, executive director of the Conservation Council of New Brunswick, welcomed the report although pointed to some shortcomings.
"For what it does have in it, it's a very good report and it's relatively easy to follow along."
She said many indicators of water quality are left out, however. For example, the report doesn't include any data on groundwater or well water.
There aren't many comparisons of trends over time.
And it doesn't cover what Corbett described as "the nastier things that are still in some of our waterways."
"Think way way back to DDT, for example. We have some concentrations of that in some streams and rivers in New Brunswick."
If we if we followed up on every single variable or parameter that went up compared to the year before, it's debilitating. - Michelle Gray, University of New Brunswick
Neither does it capture heavy metals such as mercury, she said, which accumulates in head ponds above dams, including Mactaquac and Beechwood.
Gray said the report is largely a good-news message because most of the test sites were within the good and excellent ranges for water quality.
None of the contents of the report surprised her because she's been working closely with the government to develop monitoring triggers related to water quality on the St. John River.

There were, however, eight test sites on rivers with only "fair" ratings — meaning guidelines were sometimes exceeded, possibly by wide margins.
Sites with lowest water quality
They include three locations on the St. John River — at Lower Lincoln, above Grand Falls and at Evandale, the Aroostook River at the Route 2 bridge, the Oromocto River at Route 102, the Petitcodiac River below Petitcodiac, the Lepreau River above the Route 780 bridge and the Kennebecasis River at the Bloomfield bridge.
The potential influences at each site vary.
In Lower Lincoln, which had the lowest quality among the test sites, housing and infrastructure projects were suspected.
In other locations, it could have also been agriculture and forestry work.
Gray said this data could be used to make good science-based decisions about future development plans near bodies of water.
She also thinks it will be of interest to anglers, watershed groups and the growing number of average citizens who are concerned about environmental issues.
"Maybe you see something you're not sure of, and probably people wonder.
"So this is finally a place where people might be able to go and get some peace of mind, hopefully."

Or if they live near one of the spots that's been flagged for having lower water quality, she said, it may get them interested in finding out why.
The report showed some test sites had phosphorus levels approaching or exceeding guideline values.
"Phosphorus is one of those nutrients that we have to watch," said Corbett.
Toxic algae
That's because it can contribute to the growth of toxic algae, which was flagged as a hazard last summer on the St. John River and has been an issue in a number of lakes as well.
Phosphorus comes from things like municipal and industrial effluent, lawn fertilizer and faulty or undersized sewage disposal systems.
The sites with the highest phosphorus values were on the St. John River. The report's map pegs them in the Edmundston, Grand Falls and Florenceville-Bristol areas.

A couple of lakes also had high levels of phosphorus — French and Washademoak.
"There is a lot of large-scale clearcut in and around those two lakes," said Corbett, adding there may be other geological factors at play that warrant further investigation.
Fifteen of New Brunswick's approximately 2,500 lakes have experienced algae blooms, said the report, including Chamcook, which supplies drinking water to Saint Andrews, and the Tower Road Reservoir, which supplies water in Moncton.
Most of the affected lakes have "significant human influences," said the report, but some are "quite remote," so the reasons why are not obvious.
Besides phosphorus, other factors that can contribute to an algal bloom include nitrogen, shallow slow-moving water, run-off from intense rain, warmer temperatures and a longer growing season.

"In a warmer world we have to take every step available," said Corbett.
"We have to do everything we can do to help the nature of the water in our lakes protect itself.
"And that means much wider buffer zones and please don't put phosphorus from sewage into our rivers and lakes and streams."
E. coli
The sites with the highest E. coli levels, a potentially deadly bacteria commonly associated with sewage pollution, were in the St. John River near Edmundston and the Petitcodiac River near Salisbury and Petitcodiac.
But they were all well below Health Canada's guidelines for recreation.
The report, of course, only looked at fresh water. It didn't include beaches, some of which have been closed to swimmers on multiple days due to high E. coli counts.
Gray said the report is "a great initiative," since the department has been collecting this kind of data for decades.
New Brunswick has now synchronized some of its data collection methods with those of other jurisdictions.
That helps broaden the picture and makes it easier to target problems, she said.
"If we if we followed up on every single variable or parameter that went up compared to the year before, it's debilitating," said Gray.
"But if we can develop a robust sort of baseline or background, so we understand what that net range of natural variability is, we can focus and direct our monitoring and our management management efforts far better."
Missing data
Still, there is a lot more information about water quality out there, that's not included in this report.
Some of it has been collected by volunteers with watershed and lake associations.
Watershed associations have already uploaded their own data to a portal shared by Nova Scotia and Prince Edward Island called the Atlantic Data Stream.
"I think once we can also get the provincial government data into that portal it's going to make it much more robust and more rigorous," Gray said.
She and Corbett said they would like to see more data included in future annual reports.
Emerging issues
The report flagged a few other issues that negatively affect water quality: sedimentation and erosion, bacteria contamination of surface waters, changing water levels and temperatures due to climate change, pesticides and herbicides.
Looking ahead, it flagged emerging concerns about chemicals and nano particles being detected in water bodies from industrial processes, as well as consumer and pharmaceutical products.

