
The data-driven pandemic: Information sharing with COVID-19 is 'unprecedented'
In the early days of Canada's COVID-19 outbreak, Elisa Baniassad was able to trace how new cases were spreading and plan her outings accordingly.
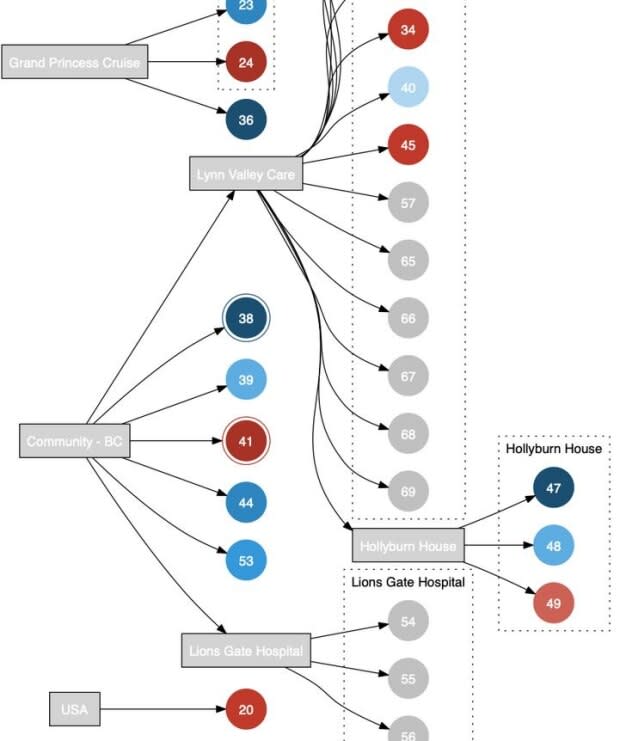
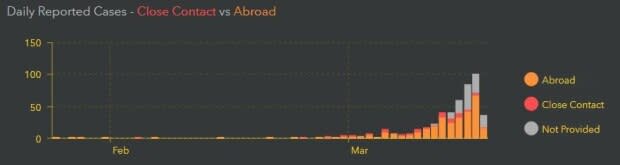
"When I plotted how the virus was being transmitted, I saw that it was from close contact. People weren't getting it out on the street, they were getting it at home from their family members," said the computer science instructor at the University of British Columbia.
Baniassad is one of a handful of people making use of the reams of data being collected and published daily around the world to help governments and citizens plan and be informed of the latest situation.
Her diagrams are published on ViriHealth.com, a website started by someone in Toronto to keep track of the information released by the provinces.
Welcome to humanity's first data-driven pandemic.
"This pandemic is unprecedented, and the amount of data sharing is unprecedented," said David Buckeridge, a professor of epidemiology at McGill University's medical school. "I've never seen this much activity of people making data so openly available."
Every day, countries and regional governments are releasing the number of new cases, tests conducted, deaths and recoveries. In some cases, they release how new infections are linked to others and how the virus is mutating as it hops borders.
This allows researchers to do quick analyses and forecast future infections, along with better advising governments and citizens on how to respond, Buckeridge said.
His team, in fact, received federal funding to measure countries' responses based on new daily cases.
"We're been trending towards this over time, being open and releasing data as it's generated," said Allison Black, a PhD candidate in epidemiology at the University of Washington in Seattle.
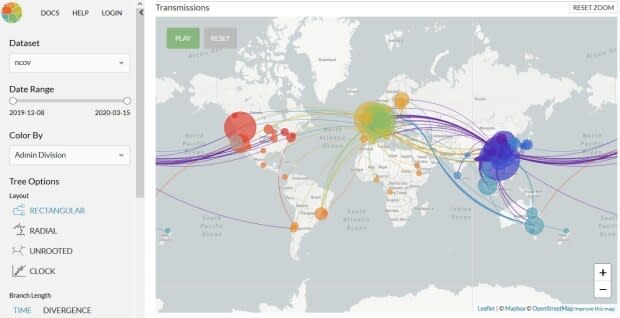
She is one of several people behind NextStrain, a website that traces the genetic mutations of the novel coronavirus and other pathogens for laboratory researchers to use.
"The release of coronavirus data has been incredibly inspiring. The scale that it's happening at is new," Black said.

Canada case data hard to compile
In Canada, daily news about new COVID-19 cases comes from provincial health authorities, often in inconsistent ways, and compiling it into a single national dataset is challenging. Still, some have stepped up.
Isha Berry, a PhD student at the University of Toronto's Dalla Lana school of public health, assembled a team that scans provincial releases each day and standardizes the data in one spreadsheet, which is publicly available.
But a spreadsheet makes it hard to see how the disease is evolving in Canada, so her team made an online dashboard that shows a daily portrait in a visual way.
"It allows people to see summaries at national level, to see what's happening in a clearer way," Berry said.
Another Canadian effort to collate and simplify information is ViriHealth.com, started by a project manager in Toronto. The world's largest maker of mapping software, Esri, is using the daily data from ViriHealth to power its own Canadian dashboard, released last Friday, which has the most granular geographic breakdown of cases.
Esri has clients in all levels of government, and they're all asking for help to better plan responses and resources, said Chris North, the company's director of technology adoption.
"A lot of them don't have time to react. They are dealing with other aspects of the crisis," he said.
Esri is also crossing global pandemic data with its own data on socioeconomic measures to see if it can identify areas that could be hit harder by the virus to help their customers prioritize responses.
Data details slim as cases grow
Baniassad is no longer able to trace how the virus is being transmitted in B.C. The data put out by the British Columbia government was detailed in the first few days but as the numbers grow, it's down to the bare essentials: number of new daily cases, deaths and recoveries.
Other provincial governments seem to be doing the same.
"It's frustrating because now they're just giving aggregate numbers for the population," Baniassad said. It's no longer possible to see how many new cases are linked, for example, to an initial cluster at the Lynn Valley Care Centre in Vancouver.
She compares it to Singapore, which continues to release detailed information on each case, including clusters of infection, such as 23 cases linked to a church or 47 cases at a dinner party.
"It's calming for people to have a sense that they're being fully informed," she said. "My mother likes going to church. Having full knowledge where the infection clusters are, we can make more informed decisions."
Resources to keep up with the COVID-19 pandemic
Canada-specific:
Dashboard from the University of Toronto's Dalla Lana school of public health
Esri Canada dashboard and community risk profiles
ViriHealth
Radio-Canada dashboard (French)
Global:
Johns Hopkins CSSE dashboard
HealthMap, an animated map of global cases
nCoV2019Live by Avi Schiffman, a high schooler in Washington State
NextStrain

