
How Does Rectifier Technologies's (ASX:RFT) P/E Compare To Its Industry, After The Share Price Drop?

Unfortunately for some shareholders, the Rectifier Technologies (ASX:RFT) share price has dived 37% in the last thirty days. Even longer term holders have taken a real hit with the stock declining 23% in the last year.
Assuming nothing else has changed, a lower share price makes a stock more attractive to potential buyers. In the long term, share prices tend to follow earnings per share, but in the short term prices bounce around in response to short term factors (which are not always obvious). So, on certain occasions, long term focussed investors try to take advantage of pessimistic expectations to buy shares at a better price. One way to gauge market expectations of a stock is to look at its Price to Earnings Ratio (PE Ratio). Investors have optimistic expectations of companies with higher P/E ratios, compared to companies with lower P/E ratios.
Check out our latest analysis for Rectifier Technologies
Does Rectifier Technologies Have A Relatively High Or Low P/E For Its Industry?
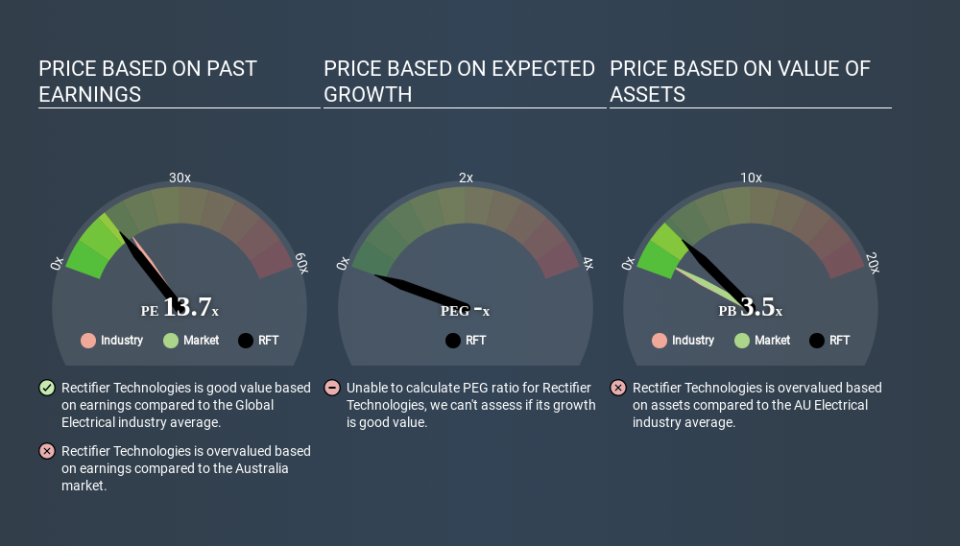
Rectifier Technologies's P/E of 13.68 indicates relatively low sentiment towards the stock. If you look at the image below, you can see Rectifier Technologies has a lower P/E than the average (15.7) in the electrical industry classification.
Rectifier Technologies's P/E tells us that market participants think it will not fare as well as its peers in the same industry. While current expectations are low, the stock could be undervalued if the situation is better than the market assumes. If you consider the stock interesting, further research is recommended. For example, I often monitor director buying and selling.
How Growth Rates Impact P/E Ratios
Generally speaking the rate of earnings growth has a profound impact on a company's P/E multiple. When earnings grow, the 'E' increases, over time. Therefore, even if you pay a high multiple of earnings now, that multiple will become lower in the future. Then, a lower P/E should attract more buyers, pushing the share price up.
Rectifier Technologies's earnings made like a rocket, taking off 169% last year. The cherry on top is that the five year growth rate was an impressive 31% per year. So I'd be surprised if the P/E ratio was not above average.
A Limitation: P/E Ratios Ignore Debt and Cash In The Bank
The 'Price' in P/E reflects the market capitalization of the company. That means it doesn't take debt or cash into account. Hypothetically, a company could reduce its future P/E ratio by spending its cash (or taking on debt) to achieve higher earnings.
Spending on growth might be good or bad a few years later, but the point is that the P/E ratio does not account for the option (or lack thereof).
So What Does Rectifier Technologies's Balance Sheet Tell Us?
Rectifier Technologies has net cash of AU$2.5m. That should lead to a higher P/E than if it did have debt, because its strong balance sheets gives it more options.
The Bottom Line On Rectifier Technologies's P/E Ratio
Rectifier Technologies has a P/E of 13.7. That's around the same as the average in the AU market, which is 13.1. Its net cash position is the cherry on top of its superb EPS growth. So based on this analysis we'd expect Rectifier Technologies to have a higher P/E ratio. What can be absolutely certain is that the market has become significantly less optimistic about Rectifier Technologies over the last month, with the P/E ratio falling from 21.7 back then to 13.7 today. For those who don't like to trade against momentum, that could be a warning sign, but a contrarian investor might want to take a closer look.
Investors have an opportunity when market expectations about a stock are wrong. People often underestimate remarkable growth -- so investors can make money when fast growth is not fully appreciated. We don't have analyst forecasts, but you could get a better understanding of its growth by checking out this more detailed historical graph of earnings, revenue and cash flow.
You might be able to find a better buy than Rectifier Technologies. If you want a selection of possible winners, check out this free list of interesting companies that trade on a P/E below 20 (but have proven they can grow earnings).
If you spot an error that warrants correction, please contact the editor at editorial-team@simplywallst.com. This article by Simply Wall St is general in nature. It does not constitute a recommendation to buy or sell any stock, and does not take account of your objectives, or your financial situation. Simply Wall St has no position in the stocks mentioned.
We aim to bring you long-term focused research analysis driven by fundamental data. Note that our analysis may not factor in the latest price-sensitive company announcements or qualitative material. Thank you for reading.

