
Is Good Energy Group PLC’s (LON:GOOD) 7.3% ROCE Any Good?

Today we'll evaluate Good Energy Group PLC (LON:GOOD) to determine whether it could have potential as an investment idea. In particular, we'll consider its Return On Capital Employed (ROCE), as that can give us insight into how profitably the company is able to employ capital in its business.
First up, we'll look at what ROCE is and how we calculate it. Then we'll compare its ROCE to similar companies. And finally, we'll look at how its current liabilities are impacting its ROCE.
Return On Capital Employed (ROCE): What is it?
ROCE is a measure of a company's yearly pre-tax profit (its return), relative to the capital employed in the business. All else being equal, a better business will have a higher ROCE. Ultimately, it is a useful but imperfect metric. Renowned investment researcher Michael Mauboussin has suggested that a high ROCE can indicate that 'one dollar invested in the company generates value of more than one dollar'.
So, How Do We Calculate ROCE?
Analysts use this formula to calculate return on capital employed:
Return on Capital Employed = Earnings Before Interest and Tax (EBIT) ÷ (Total Assets - Current Liabilities)
Or for Good Energy Group:
0.073 = UK£5.9m ÷ (UK£123m - UK£43m) (Based on the trailing twelve months to June 2019.)
So, Good Energy Group has an ROCE of 7.3%.
Check out our latest analysis for Good Energy Group
Does Good Energy Group Have A Good ROCE?
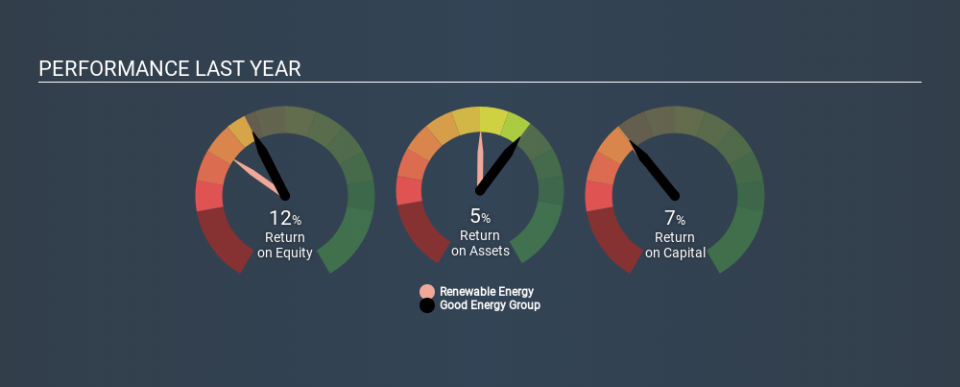
ROCE is commonly used for comparing the performance of similar businesses. Good Energy Group's ROCE appears to be substantially greater than the 5.3% average in the Renewable Energy industry. We would consider this a positive, as it suggests it is using capital more effectively than other similar companies. Aside from the industry comparison, Good Energy Group's ROCE is mediocre in absolute terms, considering the risk of investing in stocks versus the safety of a bank account. It is possible that there are more rewarding investments out there.
The image below shows how Good Energy Group's ROCE compares to its industry, and you can click it to see more detail on its past growth.
It is important to remember that ROCE shows past performance, and is not necessarily predictive. Companies in cyclical industries can be difficult to understand using ROCE, as returns typically look high during boom times, and low during busts. ROCE is only a point-in-time measure. What happens in the future is pretty important for investors, so we have prepared a free report on analyst forecasts for Good Energy Group.
Do Good Energy Group's Current Liabilities Skew Its ROCE?
Current liabilities include invoices, such as supplier payments, short-term debt, or a tax bill, that need to be paid within 12 months. Due to the way ROCE is calculated, a high level of current liabilities makes a company look as though it has less capital employed, and thus can (sometimes unfairly) boost the ROCE. To counteract this, we check if a company has high current liabilities, relative to its total assets.
Good Energy Group has current liabilities of UK£43m and total assets of UK£123m. Therefore its current liabilities are equivalent to approximately 35% of its total assets. Good Energy Group has a medium level of current liabilities, which would boost its ROCE somewhat.
The Bottom Line On Good Energy Group's ROCE
With this level of liabilities and a mediocre ROCE, there are potentially better investments out there. But note: make sure you look for a great company, not just the first idea you come across. So take a peek at this free list of interesting companies with strong recent earnings growth (and a P/E ratio below 20).
I will like Good Energy Group better if I see some big insider buys. While we wait, check out this free list of growing companies with considerable, recent, insider buying.
If you spot an error that warrants correction, please contact the editor at editorial-team@simplywallst.com. This article by Simply Wall St is general in nature. It does not constitute a recommendation to buy or sell any stock, and does not take account of your objectives, or your financial situation. Simply Wall St has no position in the stocks mentioned.
We aim to bring you long-term focused research analysis driven by fundamental data. Note that our analysis may not factor in the latest price-sensitive company announcements or qualitative material. Thank you for reading.

