
Here's What Winox Holdings Limited's (HKG:6838) P/E Is Telling Us

The goal of this article is to teach you how to use price to earnings ratios (P/E ratios). We'll apply a basic P/E ratio analysis to Winox Holdings Limited's (HKG:6838), to help you decide if the stock is worth further research. What is Winox Holdings's P/E ratio? Well, based on the last twelve months it is 8.85. That corresponds to an earnings yield of approximately 11.3%.
Check out our latest analysis for Winox Holdings
How Do You Calculate A P/E Ratio?
The formula for P/E is:
Price to Earnings Ratio = Price per Share ÷ Earnings per Share (EPS)
Or for Winox Holdings:
P/E of 8.85 = HK$2.450 ÷ HK$0.277 (Based on the trailing twelve months to December 2019.)
(Note: the above calculation results may not be precise due to rounding.)
Is A High Price-to-Earnings Ratio Good?
A higher P/E ratio means that investors are paying a higher price for each HK$1 of company earnings. That is not a good or a bad thing per se, but a high P/E does imply buyers are optimistic about the future.
Does Winox Holdings Have A Relatively High Or Low P/E For Its Industry?
One good way to get a quick read on what market participants expect of a company is to look at its P/E ratio. The image below shows that Winox Holdings has a higher P/E than the average (7.2) P/E for companies in the luxury industry.
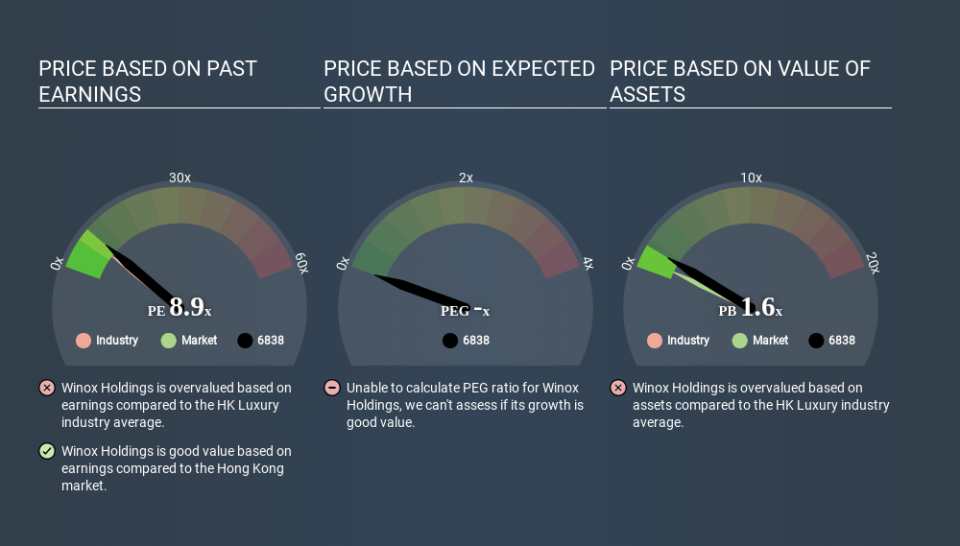
Its relatively high P/E ratio indicates that Winox Holdings shareholders think it will perform better than other companies in its industry classification. The market is optimistic about the future, but that doesn't guarantee future growth. So investors should always consider the P/E ratio alongside other factors, such as whether company directors have been buying shares.
How Growth Rates Impact P/E Ratios
Generally speaking the rate of earnings growth has a profound impact on a company's P/E multiple. If earnings are growing quickly, then the 'E' in the equation will increase faster than it would otherwise. Therefore, even if you pay a high multiple of earnings now, that multiple will become lower in the future. A lower P/E should indicate the stock is cheap relative to others -- and that may attract buyers.
Winox Holdings shrunk earnings per share by 10% over the last year. But over the longer term (5 years) earnings per share have increased by 25%.
Don't Forget: The P/E Does Not Account For Debt or Bank Deposits
Don't forget that the P/E ratio considers market capitalization. So it won't reflect the advantage of cash, or disadvantage of debt. Hypothetically, a company could reduce its future P/E ratio by spending its cash (or taking on debt) to achieve higher earnings.
While growth expenditure doesn't always pay off, the point is that it is a good option to have; but one that the P/E ratio ignores.
How Does Winox Holdings's Debt Impact Its P/E Ratio?
The extra options and safety that comes with Winox Holdings's HK$67m net cash position means that it deserves a higher P/E than it would if it had a lot of net debt.
The Verdict On Winox Holdings's P/E Ratio
Winox Holdings trades on a P/E ratio of 8.9, which is fairly close to the HK market average of 9.1. While the absence of growth in the last year is probably causing a degree of pessimism, the net cash position means it's not surprising that expectations put the company roughly in line with the market average P/E.
When the market is wrong about a stock, it gives savvy investors an opportunity. If it is underestimating a company, investors can make money by buying and holding the shares until the market corrects itself. Although we don't have analyst forecasts shareholders might want to examine this detailed historical graph of earnings, revenue and cash flow.
You might be able to find a better buy than Winox Holdings. If you want a selection of possible winners, check out this free list of interesting companies that trade on a P/E below 20 (but have proven they can grow earnings).
If you spot an error that warrants correction, please contact the editor at editorial-team@simplywallst.com. This article by Simply Wall St is general in nature. It does not constitute a recommendation to buy or sell any stock, and does not take account of your objectives, or your financial situation. Simply Wall St has no position in the stocks mentioned.
We aim to bring you long-term focused research analysis driven by fundamental data. Note that our analysis may not factor in the latest price-sensitive company announcements or qualitative material. Thank you for reading.

