
How do household bills, expenses in the Tri-Cities stack up against the rest of the state?
Sometimes, it feels like everyone has an anecdote or a trick for financial success. From simple concepts, like spending no more than a third of your monthly income on rent, to savings systems, like only buying things you can afford twice, and everything in between.
With the prices going up for just about everything, the ability to follow strict financial guidelines has only become more difficult for the average person.
Recent analysis by doxo outlines the average monthly bills paid in numerous cities in Washington and nationwide, comparing city averages to other cities, state averages and federal averages.
Average households bills in Washington state
According to the doxo data, the average household in the U.S. pays $2,046 in bills each month. The majority of these payments go toward the mortgage or rent.
In Washington state specifically, the average household pays $2,468 in bills each month, about 37% of their income. This secured the Evergreen State the number eight slot on the ranking of states with the highest monthly household bills.
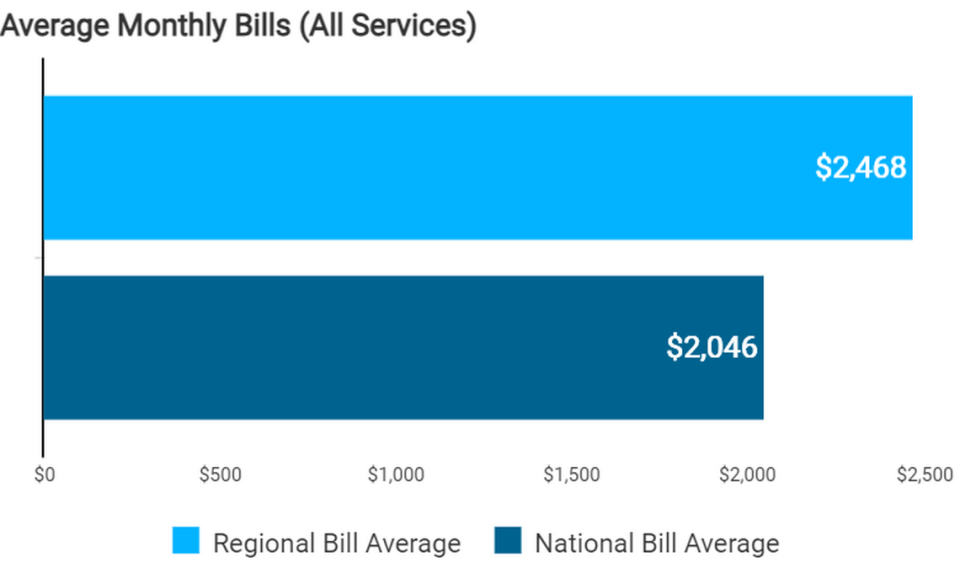
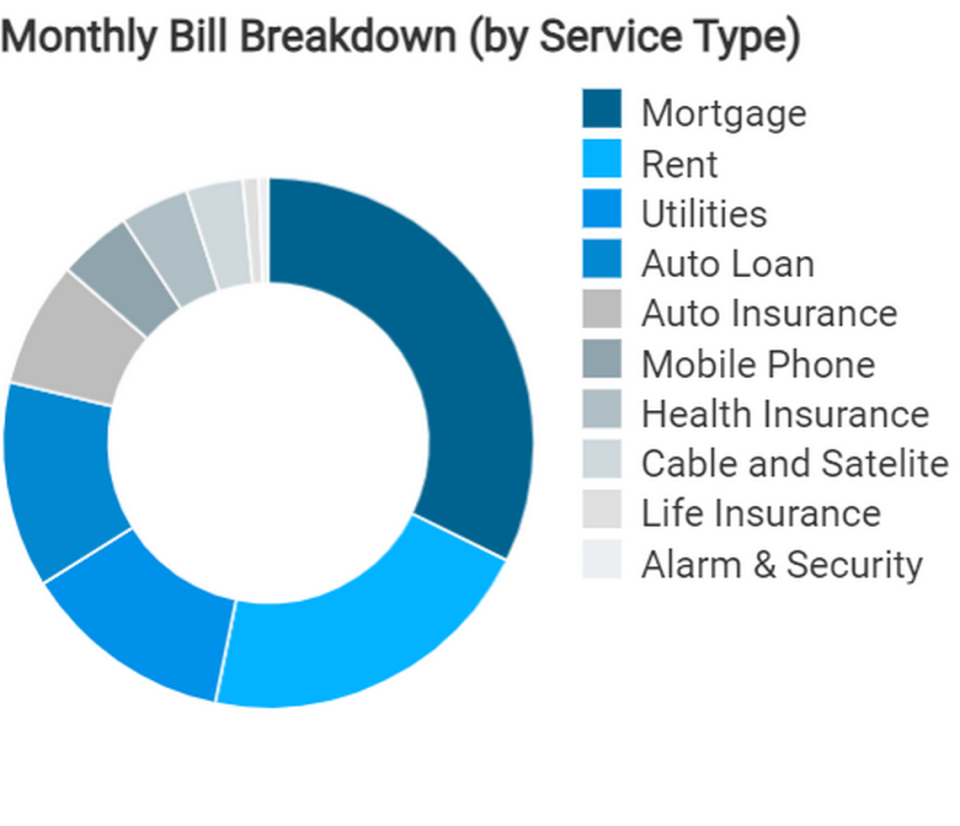
doxo also looked at comparisons across specific bills and payment categories. Washington’s averages were about the same as national averages, except when it came to monthly mortgage and rent payments. Washington overtook the national averages there by over $500 and by $285, respectively.
WA average household bills by county
There is also county and city specific data available. The ten counties with the highest monthly household expenses in the state are:
King - $2,988
Snohomish - $2,698
Island - $2,614
Thurston - $2,584
Whatcom - $2,467
Pierce - $2,460
Skagit - $2,277
Chelan - $2,211
Kitsap - $2,187
Benton - $2,156
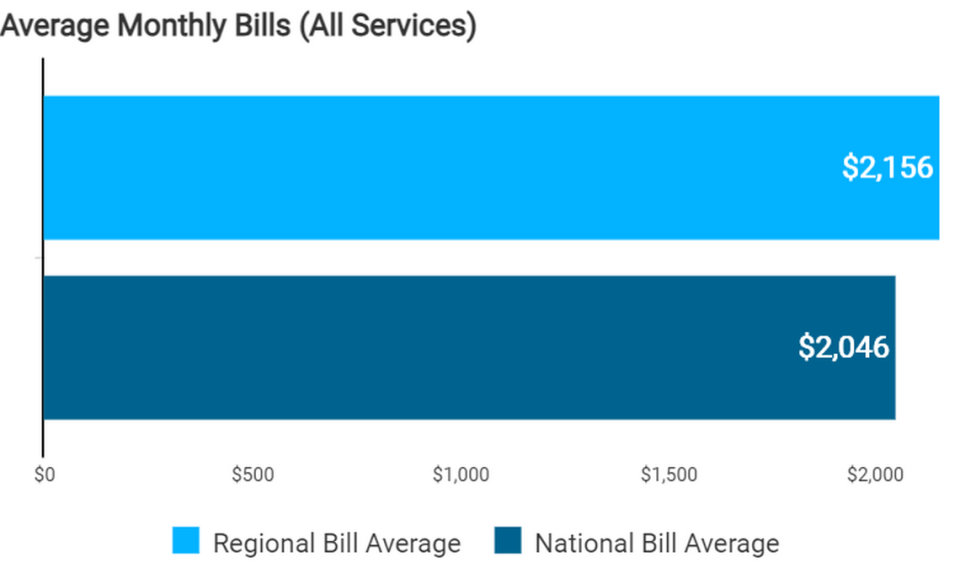

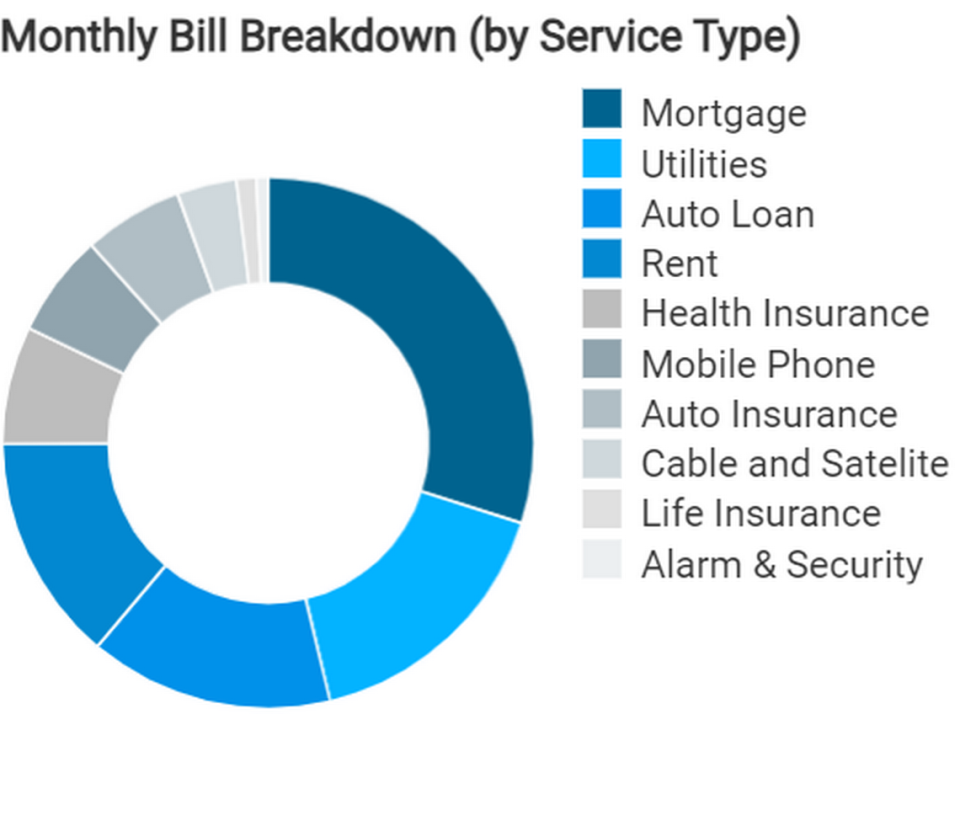
Many of the household expenses examined are fairly similar between Benton County and the national average. But there were a few categories with significant difference.
The average mortgage is $112 per month than the national average.
Conversely, rent is $120 less per month than the national average.
Over half of Benton County households are paying auto loans, with an average cost more than double the national average.
Health insurance is nearly half the national average, though this is likely influenced by former employees of the Hanford Nuclear Plant.
Less than a third of households are paying for life insurance. Average payments are almost half of the national average.

Not far down the list, Franklin County came out at 16, with households averaging monthly expenses of $1,987, or 36% of their income. All differences between the national averages and Franklin County averages were less than $100.
WA average household bills by city
Individual cities were also examined. The 10 cities in Washington state with the highest average monthly household expenses are:
Sammamish - $3,879
Redmond - $3,631
Mercer Island - $3,513
Bellevue - $3,475
Issaquah - $3,410
Woodinville - $3,365
Kirkland - $3,272
Maple Valley - $3,233
Snohomish - $3,074
Bothell - $3,069
In Tri-Cities, Pasco ranked 60, Richland ranked 65 and Kennewick ranked 68. Here are some fast facts on the data for each city:
▪ Pasco
Average household spends $2,190 each month on bills, about 39% of their income.
Generally, more than half of the total dollar amount goes to mortgage and auto loan payments.
Standard rent is $200 cheaper than the national average
About 57% of households pay auto loans. Average payment is nearly double the national average.
▪ Richland
Average household spends $2,091 each month on bills, about 33% of their income
More than half of the total dollar amount goes to mortgage and auto loan payments.
The average monthly mortgage rate is $265 more than the national average.
About 52% of households pay auto loans. Average payment is nearly double the national average.
Monthly phone and cable/Internet bills are about half the national average.
Fairly equal to the national average in many categories.
Average household spends $2,048 on bills, about 36% of their income.
About 55% of households pay auto loans. Average payment is nearly double the national average.

