
New mapping project at Lethbridge museum shows the unseen boundaries that divide cities
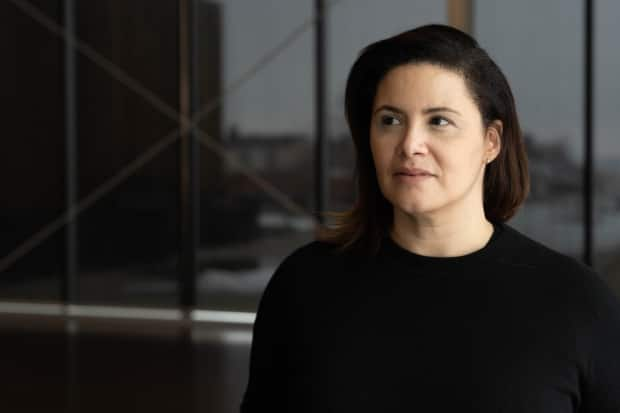
Jessica Thompson wants cities to take a closer look at their maps and themselves.
The media artist and professor of hybrid media at the University of Waterloo was in Lethbridge, Alta., to lead a talk and open discussion at the Galt Museum and Archives on critical map making, a discipline that looks how maps are influenced by existing power structures and social issues.
Her project Borderline uses data to map and highlight the often unseen boundaries that divide cities.
"While you could say that maps are a tool that have been used to colonize and control others, knowing how maps work and knowing how to create good maps is is very empowering," said Thompson.
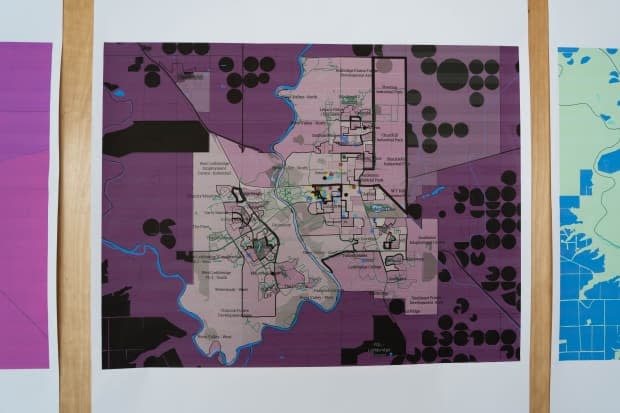
Her and the team at the Urban Borderlines Research Lab compares census data in dissemination areas — the smallest geographic area census information is available in — to calculate the degree of difference between adjacent areas. The bigger the difference the thicker the border. This helps identify where invisible borders exist in cities and within neighbourhoods.
Most people consider maps factual, but Thompson says they can often blur information. For example United States electoral maps painted states as either red or blue after the 2016 election.
"But of course once you got closer and zoomed into the electoral districts and then re-framed the data so that you actually looked at each electoral district, you realized that America is varied."
Map making as an art form
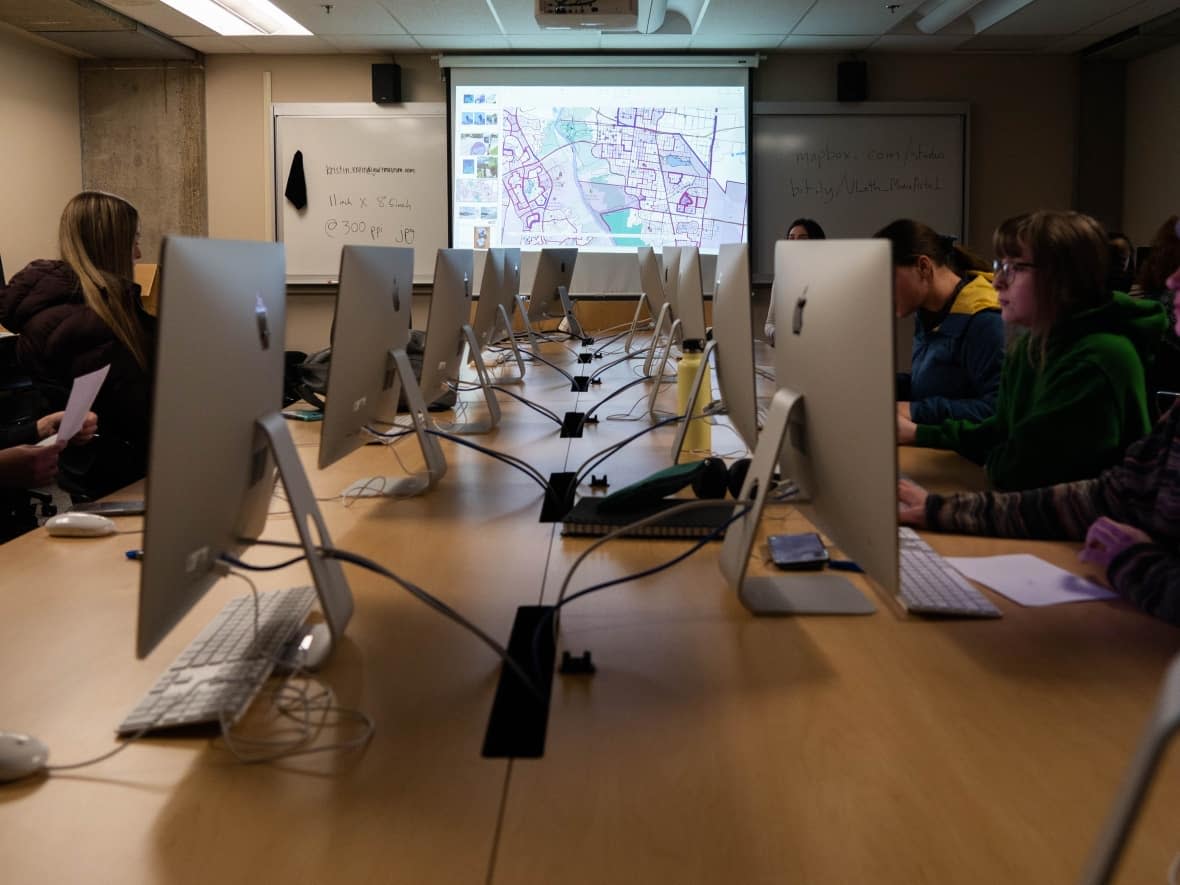
As part of her visit, Thompson led a workshop at the University of Lethbridge for students in the art department. There, they were introduced to mapping software and designed their own critical maps based on Lethbridge census data. Those maps were part of the discussion at her museum talk.
It was the first time many of these students had been introduced to map making.
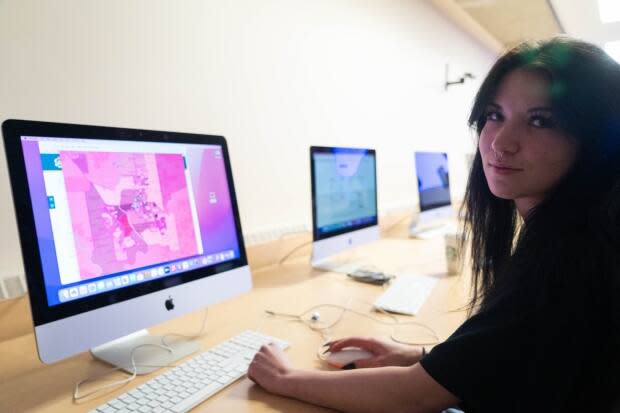
"I never would have thought that map making would be a form of artistry," said first year studio arts student Natasha Farkas who went for a bright pink colour scheme in her map.
Beyond the technical and artistic elements, one of the session's goals was for students to gain a deeper understanding of Lethbridge.
"I think that once you see your city through data, you don't see it in the same way, said Thompson."
The data students used focused on people who spent more than 30 per cent of their income on shelter. This is often used as a financial measure for housing instability. Through their maps students were able to identify areas in Lethbridge where people are struggling to pay rent or keep up with their mortgages.
Areas like the neighbourhoods surrounding the university and college where many students like Farkas live.
"That was very upsetting because this is arguably one of the cheapest places to live and so many people are [having] a hard time making ends meet, including me," said Farkas.
Local knowledge important
Thompson takes her own advice and does not blindly trust maps.
"With my research, mapping is just the first step," she noted. You've got to get on the ground and look. That's where the value of local knowledge becomes really important."
She took a drive with Galt Museum curator Tyler Stewart to one of the borders identified on the city's southern edge. When they got there they saw a new development with "brand new, expensive" homes on one side and empty fields on the other.
"So the reason why we had that big thick line is because there was literally nobody. There was no income to report because there was nobody living in the middle of the fields. If I had not gone there, I might have made an assumption."
Lethbridge also divided by physical boundaries
"A lot of the benefit of her being here is thinking about what we kind of take for granted or what some of the status quo elements are are of our city," said Stewart.
"Having someone come from the outside to kind of like challenge the things we don't necessarily see every day because we're in the middle of them," he added.
The project focuses on invisible boundaries but Stewart was struck by how physical ones divide Lethbridge. The coulees and the Oldman river split the east and west while the north and south are cut by train tracks and Highway 3.
"Here in Lethbridge we often talk about this like north Lethbridge, south Lethbridge divide, like they're almost two different cities … But when you start looking at maps you are reminded [of] how much that is a physical separation," said Stewart.
These physical separations act as barriers that restrict people's movement and can limit their access to opportunities in other parts of the city, especially if they do not drive or have limited mobility.
Map making important social commentary, says professor
Thompson says data can stay invisible unless it's mapped. For example, cities boast about population growth but may not be prepared to deal with it.
"Census data comes out [and] cities are very quick to trumpet what's great about it … look at the population growth in a city or whatever it is, but there's lots of data available from the census which maybe isn't communicated."
Neighbourhoods can grow too quickly without adequate infrastructure to support them. Cities may build condominiums to appeal to new wealthier residents, but ignore the needs of existing residents.
She believes maps are a form of social commentary that can communicate important information to the public that otherwise would be ignored. But she wants people to be aware that they can also be used to misinform.
"It is just as easy to lie with a map as it is to tell a truth with a map."

