
Is Provexis's (LON:PXS) Share Price Gain Of 173% Well Earned?

Unless you borrow money to invest, the potential losses are limited. On the other hand, if you find a high quality business to buy (at the right price) you can more than double your money! For example, the Provexis plc (LON:PXS) share price has soared 173% in the last year. Most would be very happy with that, especially in just one year! It's also good to see the share price up 70% over the last quarter. The company reported its financial results recently; you can catch up on the latest numbers by reading our company report. However, the longer term returns haven't been so impressive, with the stock up just 3.2% in the last three years.
View our latest analysis for Provexis
Provexis recorded just UK£350,698 in revenue over the last twelve months, which isn't really enough for us to consider it to have a proven product. So it seems that the investors focused more on what could be, than paying attention to the current revenues (or lack thereof). It seems likely some shareholders believe that Provexis will significantly advance the business plan before too long.
We think companies that have neither significant revenues nor profits are pretty high risk. You should be aware that there is always a chance that this sort of company will need to issue more shares to raise money to continue pursuing its business plan. While some companies like this go on to deliver on their plan, making good money for shareholders, many end in painful losses and eventual de-listing. Of course, if you time it right, high risk investments like this can really pay off, as Provexis investors might know.
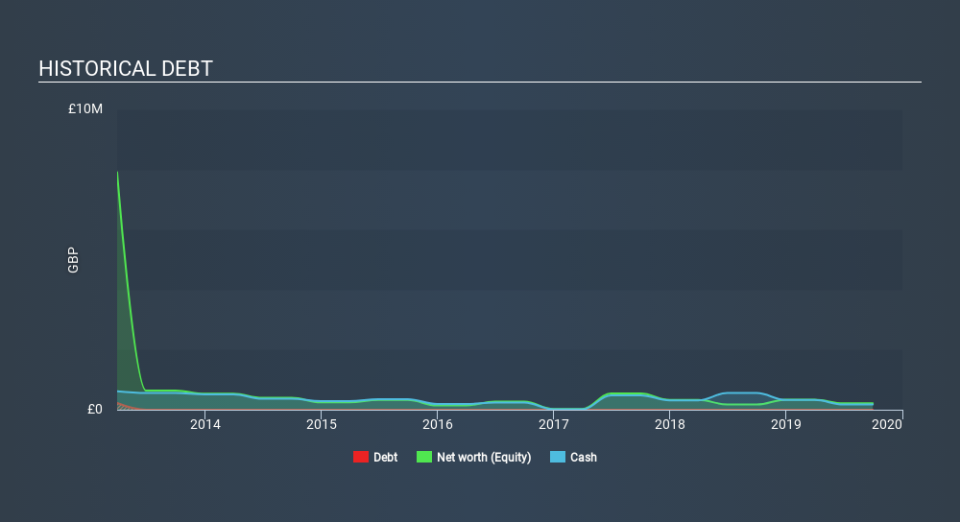
When it reported in September 2019 Provexis had minimal cash in excess of all liabilities consider its expenditure: just UK£14k to be specific. So if it hasn't remedied the situation already, it will almost certainly have to raise more capital soon. Given how low on cash the it got, investors must really like its potential for the share price to be up 79% in the last year . You can click on the image below to see (in greater detail) how Provexis's cash levels have changed over time. You can see in the image below, how Provexis's cash levels have changed over time (click to see the values).
It can be extremely risky to invest in a company that doesn't even have revenue. There's no way to know its value easily. One thing you can do is check if company insiders are buying shares. It's often positive if so, assuming the buying is sustained and meaningful. Luckily we are in a position to provide you with this free chart of insider buying (and selling).
A Different Perspective
It's nice to see that Provexis shareholders have received a total shareholder return of 173% over the last year. That certainly beats the loss of about 0.6% per year over the last half decade. We generally put more weight on the long term performance over the short term, but the recent improvement could hint at a (positive) inflection point within the business. It's always interesting to track share price performance over the longer term. But to understand Provexis better, we need to consider many other factors. For instance, we've identified 7 warning signs for Provexis (3 are significant) that you should be aware of.
If you would prefer to check out another company -- one with potentially superior financials -- then do not miss this free list of companies that have proven they can grow earnings.
Please note, the market returns quoted in this article reflect the market weighted average returns of stocks that currently trade on GB exchanges.
If you spot an error that warrants correction, please contact the editor at editorial-team@simplywallst.com. This article by Simply Wall St is general in nature. It does not constitute a recommendation to buy or sell any stock, and does not take account of your objectives, or your financial situation. Simply Wall St has no position in the stocks mentioned.
We aim to bring you long-term focused research analysis driven by fundamental data. Note that our analysis may not factor in the latest price-sensitive company announcements or qualitative material. Thank you for reading.

