
Read This Before You Buy Time Watch Investments Limited (HKG:2033) Because Of Its P/E Ratio

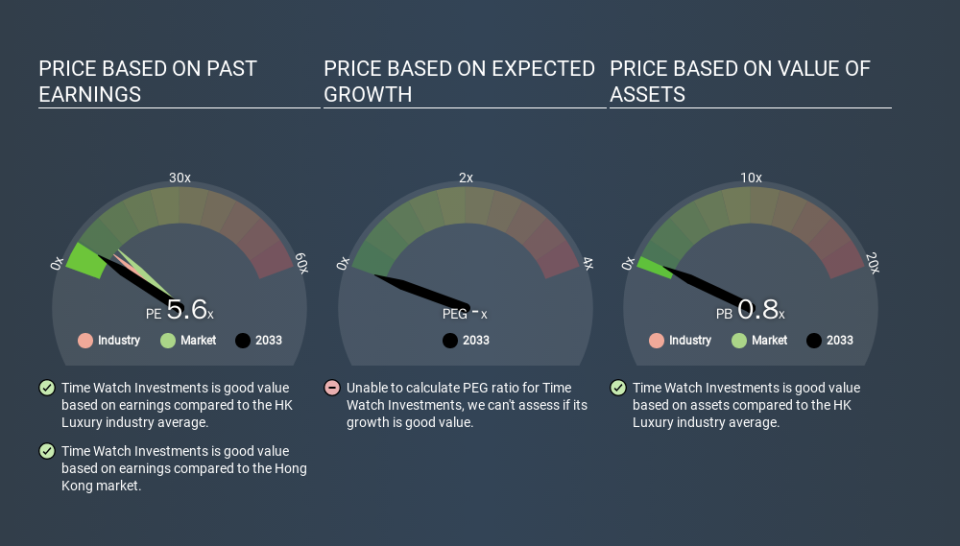
The goal of this article is to teach you how to use price to earnings ratios (P/E ratios). We'll look at Time Watch Investments Limited's (HKG:2033) P/E ratio and reflect on what it tells us about the company's share price. Time Watch Investments has a P/E ratio of 5.59, based on the last twelve months. In other words, at today's prices, investors are paying HK$5.59 for every HK$1 in prior year profit.
See our latest analysis for Time Watch Investments
How Do I Calculate A Price To Earnings Ratio?
The formula for price to earnings is:
Price to Earnings Ratio = Share Price ÷ Earnings per Share (EPS)
Or for Time Watch Investments:
P/E of 5.59 = HKD0.82 ÷ HKD0.15 (Based on the year to June 2019.)
Is A High Price-to-Earnings Ratio Good?
A higher P/E ratio implies that investors pay a higher price for the earning power of the business. That is not a good or a bad thing per se, but a high P/E does imply buyers are optimistic about the future.
Does Time Watch Investments Have A Relatively High Or Low P/E For Its Industry?
The P/E ratio indicates whether the market has higher or lower expectations of a company. We can see in the image below that the average P/E (8.2) for companies in the luxury industry is higher than Time Watch Investments's P/E.
This suggests that market participants think Time Watch Investments will underperform other companies in its industry. Since the market seems unimpressed with Time Watch Investments, it's quite possible it could surprise on the upside. If you consider the stock interesting, further research is recommended. For example, I often monitor director buying and selling.
How Growth Rates Impact P/E Ratios
P/E ratios primarily reflect market expectations around earnings growth rates. That's because companies that grow earnings per share quickly will rapidly increase the 'E' in the equation. Therefore, even if you pay a high multiple of earnings now, that multiple will become lower in the future. A lower P/E should indicate the stock is cheap relative to others -- and that may attract buyers.
Time Watch Investments increased earnings per share by 4.8% last year. And it has improved its earnings per share by 1.0% per year over the last three years.
Remember: P/E Ratios Don't Consider The Balance Sheet
The 'Price' in P/E reflects the market capitalization of the company. So it won't reflect the advantage of cash, or disadvantage of debt. The exact same company would hypothetically deserve a higher P/E ratio if it had a strong balance sheet, than if it had a weak one with lots of debt, because a cashed up company can spend on growth.
While growth expenditure doesn't always pay off, the point is that it is a good option to have; but one that the P/E ratio ignores.
How Does Time Watch Investments's Debt Impact Its P/E Ratio?
With net cash of HK$537m, Time Watch Investments has a very strong balance sheet, which may be important for its business. Having said that, at 33% of its market capitalization the cash hoard would contribute towards a higher P/E ratio.
The Verdict On Time Watch Investments's P/E Ratio
Time Watch Investments trades on a P/E ratio of 5.6, which is below the HK market average of 10.1. EPS was up modestly better over the last twelve months. And the healthy balance sheet means the company can sustain growth while the P/E suggests shareholders don't think it will.
Investors have an opportunity when market expectations about a stock are wrong. As value investor Benjamin Graham famously said, 'In the short run, the market is a voting machine but in the long run, it is a weighing machine. Although we don't have analyst forecasts you could get a better understanding of its growth by checking out this more detailed historical graph of earnings, revenue and cash flow.
Of course you might be able to find a better stock than Time Watch Investments. So you may wish to see this free collection of other companies that have grown earnings strongly.
If you spot an error that warrants correction, please contact the editor at editorial-team@simplywallst.com. This article by Simply Wall St is general in nature. It does not constitute a recommendation to buy or sell any stock, and does not take account of your objectives, or your financial situation. Simply Wall St has no position in the stocks mentioned.
We aim to bring you long-term focused research analysis driven by fundamental data. Note that our analysis may not factor in the latest price-sensitive company announcements or qualitative material. Thank you for reading.

