
U.S. Dollar Index (DX) Futures Technical Analysis – Major Upside Target 101.495, Downside Target 99.245
The U.S. Dollar is trading flat against a basket of major currencies early Friday as traders await the release of the March U.S. Non-Farm Payrolls report, which should dictate the tone of the market the rest of the session.
On Thursday, the U.S. Dollar rose against the majors for a second straight session as investors, worried about the prospect of a global recession, continued to take shelter in the greenback. With the number of coronavirus cases continuing to rise, investors are looking at the dollar as a safe-haven.
At 07:11 GMT, June U.S. Dollar Index futures are trading 100.450, up 0.179 or +0.18%.
Some analysts do not expect the dollar to extend its recent rally after the Federal Reserve took a series of measures, which have begun to have an impact, to ensure an adequate global supply of the currency.
The cost of raising U.S. Dollar funds in the Japanese Yen and Euro Swaps market stabilized on Thursday, with premiums favoring the other currencies, suggesting that greenback demand had receded from earlier in the coronavirus pandemic.
Daily Technical Analysis
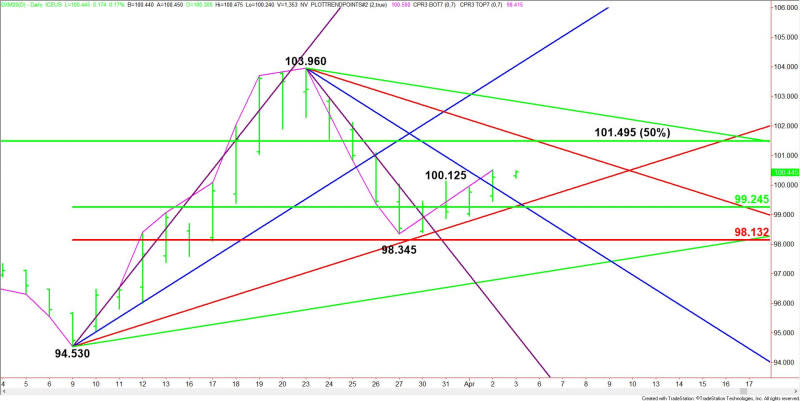
The main trend is up according to the daily swing chart. A new higher main bottom has formed at 98.345. A trade through this bottom will change the main trend to down. A move through 103.960 will signal a resumption of the uptrend.
The short-term range is 94.530 to 103.960. Its retracement zone at 99.245 to 98.130 is near-term support. This area stopped the selling at 98.345 on March 27.
Another short-term range is 103.960 to 98.345. Its retracement zone at 101.153 to 101.815 is the nearest upside target. This zone is straddling a major 50% level at 101.495.
Daily Technical Forecast
Based on the early price action and the current price at 100.450, the direction of the June U.S. Dollar Index the rest of the session on Friday is likely to be determined by trader reaction to the steep downtrending Gann angle at 99.460.
Bullish Scenario
A sustained move over 99.460 will indicate the presence of buyers. If this move creates enough upside momentum then look for a possible rally into the three retracement levels at 101.153, 101.495 and 101.815. There is also downtrending Gann angle resistance at 101.710.
Even though the main trend is up, sellers could emerge on a test of 101.15 to 101.815. They will be trying to form a secondary lower top.
Bearish Scenario
A sustained move under 99.460 will signal the presence of sellers. This could trigger a break into the 50% level at 99.245 and an uptrending Gann angle at 99.280.
If 99.280 fails as support then look for a possible acceleration into the main bottom at 98.345, followed by the main Fibonacci level at 98.130.
This article was originally posted on FX Empire

