
How Does Fletcher Building's (NZSE:FBU) P/E Compare To Its Industry, After The Share Price Drop?

Unfortunately for some shareholders, the Fletcher Building (NZSE:FBU) share price has dived 31% in the last thirty days. Even longer term holders have taken a real hit with the stock declining 30% in the last year.
Assuming nothing else has changed, a lower share price makes a stock more attractive to potential buyers. In the long term, share prices tend to follow earnings per share, but in the short term prices bounce around in response to short term factors (which are not always obvious). The implication here is that long term investors have an opportunity when expectations of a company are too low. Perhaps the simplest way to get a read on investors' expectations of a business is to look at its Price to Earnings Ratio (PE Ratio). A high P/E ratio means that investors have a high expectation about future growth, while a low P/E ratio means they have low expectations about future growth.
See our latest analysis for Fletcher Building
How Does Fletcher Building's P/E Ratio Compare To Its Peers?
We can tell from its P/E ratio of 16.11 that sentiment around Fletcher Building isn't particularly high. If you look at the image below, you can see Fletcher Building has a lower P/E than the average (17.7) in the basic materials industry classification.
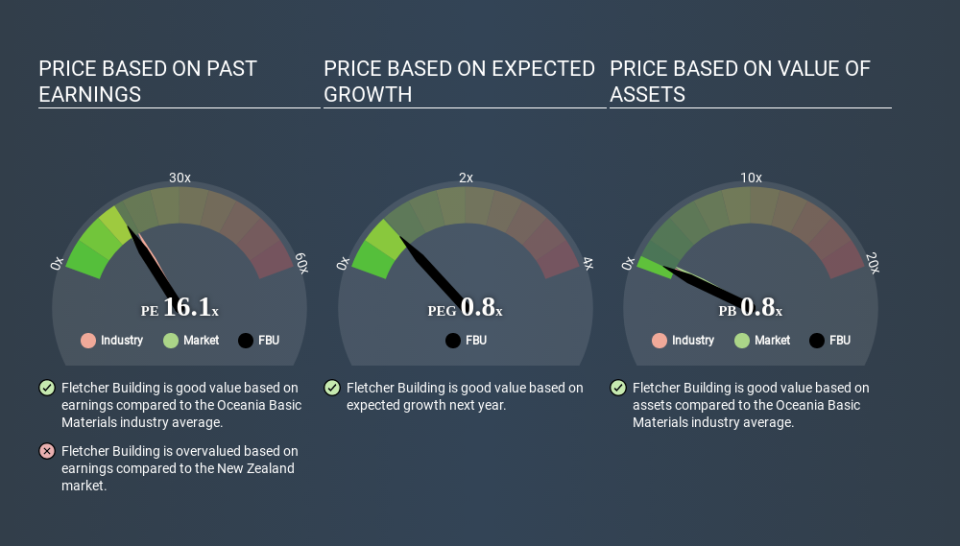
Its relatively low P/E ratio indicates that Fletcher Building shareholders think it will struggle to do as well as other companies in its industry classification. Many investors like to buy stocks when the market is pessimistic about their prospects. It is arguably worth checking if insiders are buying shares, because that might imply they believe the stock is undervalued.
How Growth Rates Impact P/E Ratios
If earnings fall then in the future the 'E' will be lower. That means unless the share price falls, the P/E will increase in a few years. Then, a higher P/E might scare off shareholders, pushing the share price down.
Fletcher Building's earnings per share fell by 5.5% in the last twelve months. And it has shrunk its earnings per share by 13% per year over the last five years. So you wouldn't expect a very high P/E.
A Limitation: P/E Ratios Ignore Debt and Cash In The Bank
It's important to note that the P/E ratio considers the market capitalization, not the enterprise value. That means it doesn't take debt or cash into account. Hypothetically, a company could reduce its future P/E ratio by spending its cash (or taking on debt) to achieve higher earnings.
Such spending might be good or bad, overall, but the key point here is that you need to look at debt to understand the P/E ratio in context.
How Does Fletcher Building's Debt Impact Its P/E Ratio?
Fletcher Building's net debt equates to 26% of its market capitalization. While that's enough to warrant consideration, it doesn't really concern us.
The Verdict On Fletcher Building's P/E Ratio
Fletcher Building's P/E is 16.1 which is about average (15.4) in the NZ market. When you consider the lack of EPS growth last year (along with some debt), it seems the market is optimistic about the future for the business. What can be absolutely certain is that the market has become significantly less optimistic about Fletcher Building over the last month, with the P/E ratio falling from 23.4 back then to 16.1 today. For those who don't like to trade against momentum, that could be a warning sign, but a contrarian investor might want to take a closer look.
When the market is wrong about a stock, it gives savvy investors an opportunity. People often underestimate remarkable growth -- so investors can make money when fast growth is not fully appreciated. So this free visualization of the analyst consensus on future earnings could help you make the right decision about whether to buy, sell, or hold.
Of course you might be able to find a better stock than Fletcher Building. So you may wish to see this free collection of other companies that have grown earnings strongly.
If you spot an error that warrants correction, please contact the editor at editorial-team@simplywallst.com. This article by Simply Wall St is general in nature. It does not constitute a recommendation to buy or sell any stock, and does not take account of your objectives, or your financial situation. Simply Wall St has no position in the stocks mentioned.
We aim to bring you long-term focused research analysis driven by fundamental data. Note that our analysis may not factor in the latest price-sensitive company announcements or qualitative material. Thank you for reading.

