
San Francisco's Diversity Numbers Are Looking More and More Like a Tech Company's
Articles like "Is San Francisco Losing Its Soul?” or “San Francisco’s Alarming Tech Bro Boom: What Is the Price of Change?” have become the norm for characterizing the city. As the refrain goes, the rising cost of living in San Francisco is forcing out the city’s teachers and artists, who are being replaced by engineers and wealthy businesspeople drawn by the tech boom.
Cities’ demographics are always changing, but many believe San Francisco’s transformation is uniquely extreme and damaging. Combine a booming economy with little housing development, and the increasing desire of young professionals to live in cities is a potent recipe for drastic movements of people. It has led to a city that some of its residents find unrecognizable.
But how much of this is hyperbole? Does the reality match the perception?
More From Our Partners

It’s impossible to quantify the cultural changes to the city. But it is possible—using Census data—to test how much San Francisco’s demographics have been altered by new arrivals.
From 2010 to 2014—the most recent period for which detailed data is available —an annual average of about 60,000 people migrated to San Francisco and about 60,000 migrated out. Since San Francisco has around 800,000 residents, that 60,000 represents about 7.5 percent of the population. The city’s population grew only slightly during that period.
Recommended: Why Richer People Spend More Time With Their Friends
The difference between the 60,000 coming and going is the main factor that’s changing the demographic character of the city. Diversity is also impacted by people getting older, dying, having children, or becoming wealthier or poorer, but in-and-out migration is the most important factor.
So what are the most notable facts about these 60,000 people?
The American Community Survey, an annual collection of data from a representative sample of Americans, asks individuals about whether they migrated in the past year, and where they came from. This data can be used to identify San Francisco’s comers and goers. (The small number of people who left for other countries are not included because they are not part of the survey.)
The basic trends are what any San Francisco resident might expect. The people moving in are more likely to have higher levels of formal education, and they tend to be younger, white, and Asian. The people moving out are less likely to have completed college, and they tend be older, African American, and Hispanic.
Increased demand to live in San Francisco, and a housing supply that has barely budged, means change at a striking scale. One of the most remarkable differences between the 60,000 moving in and the 60,000 moving out is just how many more of the new arrivals have completed some form of higher education.
San Francisco is the home of technological innovation. The city and the surrounding area are home to the headquarters of Apple, Facebook, Google, Twitter, Uber, and Tesla. Compared to the large manufacturers of the past, these high-growth tech companies have an unusual need for white-collar knowledge workers.
Recommended: The Secret Shame of Middle-Class Americans Living Paycheck to Paycheck
This demand is the most likely explanation for San Francisco’s net increase of nearly 7,000 people per year (among those at least 22-years-old) with a college or postgraduate degree. This is in contrast to a net out-migration of about 3,000 people without a college degree.
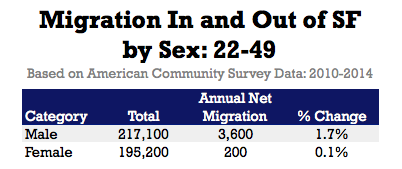
The table below displays an annual estimate of the net migration of people aged 22 to 49 who migrated in and out of the city. (This age group was chosen because this is the life period when adults are most likely to migrate.) The numbers below are based on samples, so they are not exact—generally, the net migration numbers in this article are likely to be accurate within 1,000 people.
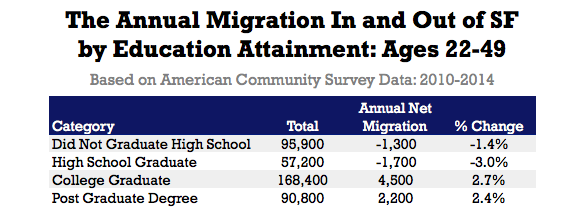
It is important to remember that having 4,500 additional college graduates does not mean that no college graduates left the city. In fact, 17,200 college graduates left for cheaper pastures. But another 21,700 college grads replaced them, leading to a net change of 4,500.
San Francisco has long been one of the U.S.’s most diverse cities. Since World War II, it has been a city with large Asian, Hispanic, white, and black populations. Yet the city is in danger of almost entirely losing one of those groups.
Perhaps no aspect of the annual migration in and out of San Francisco is as notable as the outflow of African Americans. San Francisco was 13.4 percent African American in 1970, but its population as of 2016 is less than 6 percent black. The population has steadily declined, and the trend seems likely to continue. From 2010 to 2014, there was annual net out-migration of around 2,000 African Americans from the city. That represents a 4.6 percent decline of the population every year.
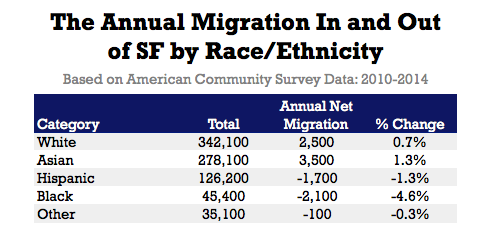
The story of San Francisco’s declining black population is characterized more by a lack of in-migration than an unusual amount of out-migration. Just about 1 in 10 African Americans who live in San Francisco leave the city every year. This is not much greater than for whites or Hispanics. This out-migration is in some ways positive, in part representing an ability to leave the city that was not possible in the days of stronger housing discrimination.
Recommended: Why So Many Smart People Aren’t Happy
The issue is that unlike other groups, African Americans are not moving to the city. There are likely a variety of issues behind this lack of in-migration. African Americans moving to the Bay Area may prefer local alternatives like Oakland that have larger African American communities, and San Francisco may not be as racially sensitive as locals like to think. In addition, the tech industry is notoriously lacking in diversity.
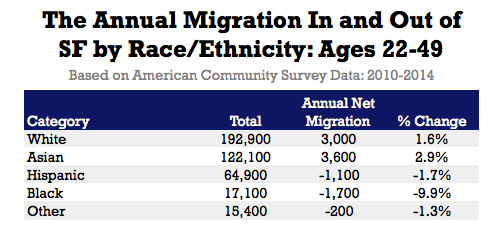
The Hispanic population is also declining, but not at quite the rate of the African American population. Both of these declines are particularly pronounced in the key age group of 22- to 49-year-olds, the period when adults are most likely to migrate.
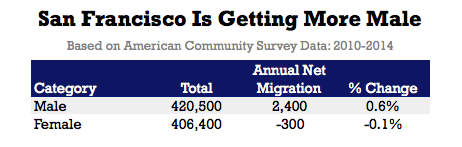
San Francisco is a particularly male city. It is home to the Castro, a center of American gay male culture, and the city’s main growth industry, tech, is heavily male.
The city was already unusually male in 2010, and the gender ratio skews more each year. Tech is a growing portion of San Francisco’s economy, and men make up about 75 percent of the city’s computer and math workers. That ratio has been stable for years and has contributed to a growing wage gap between men and women in the city.
The table below shows a net in-migration of 2,400 men per year, a 0.6 percent increase, while the female population remains the same. So, essentially all of the small population increase in San Francisco from 2010 to 2014 came from men.
And just as with the trends for racial and ethnic changes, this is more pronounced among younger adults. Men in their 20s, 30s, and 40s are pouring into the city, increasing their total by 1.7 percent each year, while the number of women in this age group is barely changing. If that 1.7 percent growth continues for the next 10 years, that would mean a nearly 20-percent increase in the number of young men.
And, like many cities, San Francisco is getting younger.
After years of aging—the city was still getting older in the 2000s—San Francisco is getting younger in the 2010s. This is, in part, a manifestation of what the writer Alan Ehrenhalt calls “The Great Inversion” —the movement of young professionals into cities that have become more appealing due to the disappearance of “factory and warehouse grime and noise,” which is pricing out the working class and lower-income families.
From 2010 to 2014, there was net annual in-migration of 7,500 people 35 or under, and net out-migration of over 5,000 for people 36 or over.
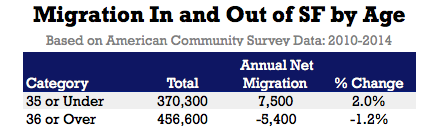
This might be considered normal: Of course young people come into the city for work and older people move out to find an affordable house near good schools.
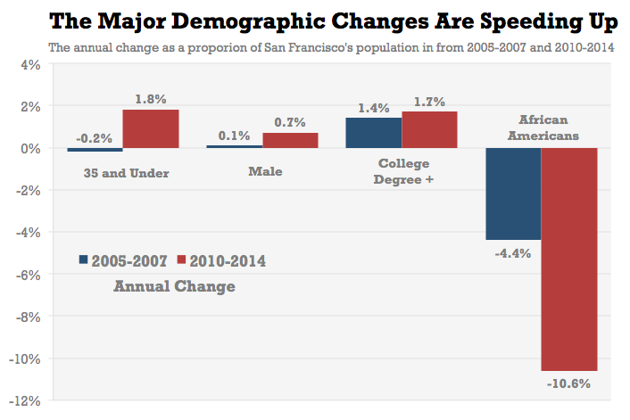
But these migration patterns have not always held. Data from 2005 to 2007 suggests that there were an equal number of older and younger people leaving the city at that time. This was before the city’s most recent tech boom, and the city’s population was getting slightly smaller.
In fact, the data suggests that all of the major migratory trends happened faster from 2010 to 2014 than they did from 2005 to 2007. The following chart shows the annual change in the proportion of San Francisco that was made up of the following four groups: people ages 35 and under, men, college graduates, and African Americans.
And then there is the question of income. Many of the changes in San Francisco are related to the increasing costs of housing. Migrants have little access to rent control, and the median monthly rent for a one-bedroom apartment in San Francisco is north of $3,000.
Yet looking into the incomes of migrants is complex because income is so closely correlated to age, gender, and education level. Also, the people who left San Francisco likely went to cities that have lower wages, so it’s not quite an apples-to-apples comparison.
A good way to look at the issue is to analyze the difference in the incomes of incoming and outgoing workers, and to see whether the difference was greater from 2010 to 2014 than it was from 2005 to 2007. The chart below shows our findings. (People who had no income were excluded from these figures.) These income estimates are likely accurate within about $2,000, and are not adjusted for inflation, so these results can primarily be interpreted as being driven by the change in the income difference between the two periods.
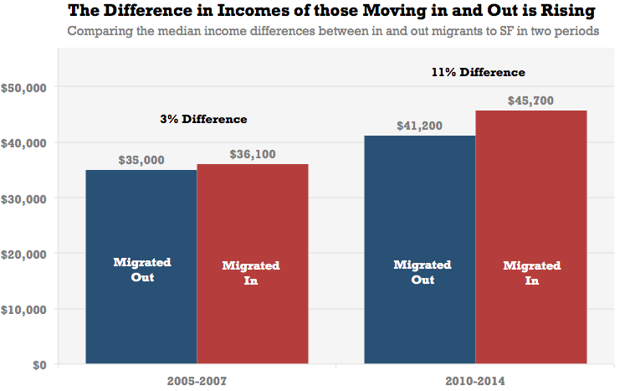
San Francisco is becoming a more expensive place to live, and the people who can afford to move in are, increasingly, wealthier than people who move out. The income gap between incoming and outgoing migrants jumped from around $1,000 between 2005 and 2007 (which is statistically negligible) to an estimate of $4,000 between 2010 and 2014.
Although a large portion of the city is still born and raised in San Francisco, migration patterns are changing the city’s demographics. And big changes are nothing new in San Francisco. Demographics have shifted dramatically after World War II, during the immigrant wave of the 1960s and ‘70s, and as a result of the dot-com boom of the 1990s.
But some residents feel that what is happening now is different—that the city is no longer accessible to all who love it, and it is becoming a place primarily for the wealthy.
The ethics of how to respond to these changes is an open question. The flourishing economy that has drawn so much in-migration has also been good for many of the people who have stayed. San Francisco is one of the best cities in the United States in terms of upward mobility.
One response that would alleviate the need for out-migration and still allow for in-migration is more housing. Subsidized housing, market-rate housing, big apartment buildings that obscure views or create wind tunnels: These all probably would help the city to retain those who want to stay.
Because of the relatively fixed housing supply, San Francisco is a zero sum game; if someone new comes to the city, they essentially must replace someone who already lives in the city. The result is a city that is younger, more highly educated, and richer by the year.
This article appears courtesy of Priceonomics.
Read more from The Atlantic:
This article was originally published on The Atlantic.

