
Here’s how wet Dallas-Fort Worth has been so far in 2024. Did that break any records?

Dallas-Fort Worth saw almost as much rain in the first five months of this year as it did in all of 2023, Fort Worth meteorologist Juan Hernandez told the Star-Telegram.
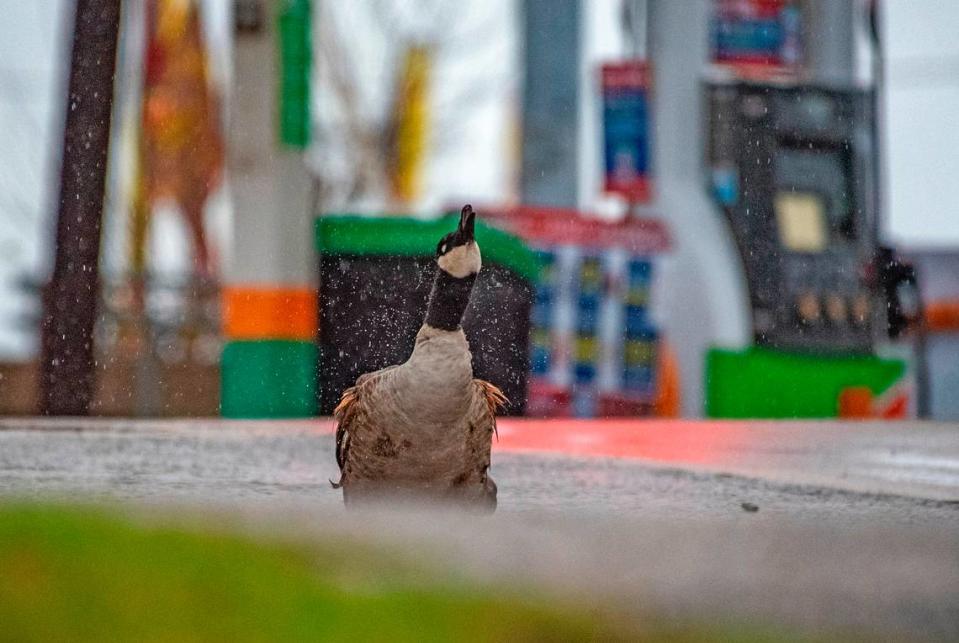
Last year’s Memorial Day weekend was 90 degrees and sunny. This year North Texas got a wet slap in the face as the region saw its wettest day in May, one day after the holiday.
“Currently, Dallas Fort Worth has gained 27.42 inches of rain this year,” Hernandez said. The total recorded rainfall for all of last year came in at only two inches — at 29.31.
And the rain isn’t over yet.
Dallas-Fort Worth can expect more rain and storms tonight through Wednesday morning, according to the National Weather Service.
⚡ More trending stories from our newsroom:
→ Video: Lightning strikes truck on I-35 in Fort Worth. "I was in shock"
→ Fort Worth increases property tax breaks for seniors
→ Want to visit new Palo Pinto state park? You'll have to wait.
Wettest day of the year in Dallas-Fort Worth
Temperatures across the region over the holiday weekend felt like a triple-digit day — topping at 98 degrees in some areas but with heat index values soaring to well over 100.
Although the Metroplex saw only a sprinkling of rain (0.28 inches) on the holiday, the next day the skies opened up making Tuesday the wettest day of May with nearly 2 inches (1.91) recorded.
Overall, May has been the wettest month of the year and February the driest. North Texas saw an average of 7.8 inches of rain, the wettest May since 2019 when the region recorded 8.15 inches. By comparison, 2023’s wettest month was October with a soggy average of 9.63 inches recorded.
So, has it been a record month? Not even close. In 2015, the Metroplex saw 16.96 inches of rain.
Here are Dallas Fort Worth’s 2024 rain totals based on measurements from the weather service station at DFW Airport.
January: 3.2 inches
February: 1.94 inches
March: 5.66 inches
April: 6.47 inches
May: 7.8 inches
June 1-3: 2.35 inches
Here’s how much water area reservoirs got over the weekend
Luckily, our rain has replenished our rivers, lakes, and streams. As you can see on the map, North Texas water conditions are normal or above expected levels.
Texas Current Water Availability and Conditions
This map shows the current Texas water conditions by watershed and currently available data for streams and reservoirs. Use the buttons below to switch the map's focus to drought conditions and above and below average stream and reservoir levels. Tap on watersheds, streams and reservoirs for more information on levels and flow rates. Water conditions are color coded with blues indicating above-normal conditions, green being normal and yellow and red indicating below-normal conditions. The streamflow and reservoir information is in real-time, and watershed information is updated daily.
SOURCES: Environmental Protection Agency, USGS National Water Information System, ESRI and US Drought Monitor.
